show the value when the spike and the dataset line crosses in the X axis
Chưa có ai nhận issue này.
- Ngôn ngữ chính
- JavaScript
- Star
- 18.3k
- Fork
- 2k
- Merge trung bình
- 2 ngày 12 giờ
- Pull request đã merge (30 ngày)
- 28
Mô tả
Sorry, couldn't describe it better in the title, if someone could suggest an edit I'd appreciate.
My point is, when you have multiple datasets and you hover a line, a popup appears in the Y axis of every other line when it crosses the spike line. I'd like to use a feature where it can be shown the popups with the value of both X and Y axis. I'm attaching an image to help to explain my problem:
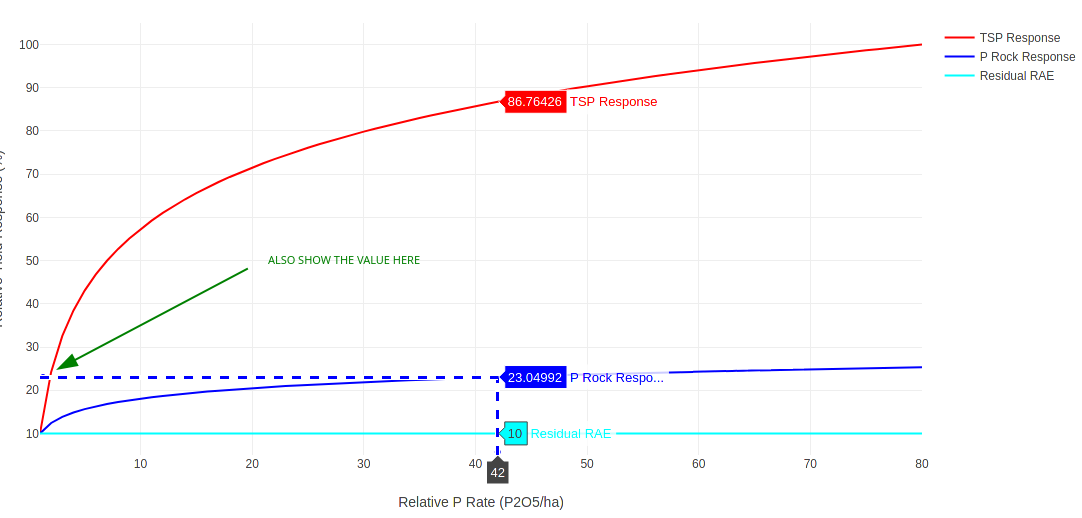
You see that I hovered the blue line and it showed the popups with the value of the red and cyan lines that met the Y axis, I want to show that same popup in the spot that I have drawn the green arrow indicating the value of the dataset when the line of the dataset and the line of the spike crosses in both axis...
Does anyone know a feature that can do that? Is that feasible? I couldn't find anything about that in the documentation of the spikes.
Thank you very much, great tool you guys developed here!
Hướng dẫn đóng góp
Bắt đầu từ đâu
- Đọc hết issue, rồi đọc hướng dẫn đóng góp của dự án.
- Bình luận trên issue rằng bạn sẽ nhận — tránh hai người làm cùng một việc.
- Fork repository và làm thay đổi trên một nhánh.
- Mở pull request có tham chiếu số hiệu của issue.
Hướng nghiên cứu
Issue không nêu tên tệp nguồn, bài kiểm thử hoặc điểm vào của phần triển khai. Bắt đầu với tài liệu spike hiện có và ví dụ đính kèm; xác định popup phải báo cáo cả giá trị X và Y như thế nào tại giao điểm của các trục chéo, sau đó kiểm tra hành vi trên nhiều tập dữ liệu.
Do mô hình lập chỉ mục viết ra từ nội dung của issue.
Đánh giá
- Công nghệ
- javascript
- Lĩnh vực
- data-visualization
- Loại issue
- Tính năng
- Độ khó
- 5/5
- Thời gian dự kiến
- Hơn một tuần
- Mức độ hoạt động
- Đình trệ
- Độ rõ ràng
- Cần làm rõ
- Mức phù hợp với người mới
- 25/100