show the value when the spike and the dataset line crosses in the X axis
Nobody has claimed this yet.
- Dominant language
- JavaScript
- Stars
- 18.3k
- Forks
- 2k
- Avg merge
- 2d 12h
- Merged PRs (30d)
- 28
Description
Sorry, couldn't describe it better in the title, if someone could suggest an edit I'd appreciate.
My point is, when you have multiple datasets and you hover a line, a popup appears in the Y axis of every other line when it crosses the spike line. I'd like to use a feature where it can be shown the popups with the value of both X and Y axis. I'm attaching an image to help to explain my problem:
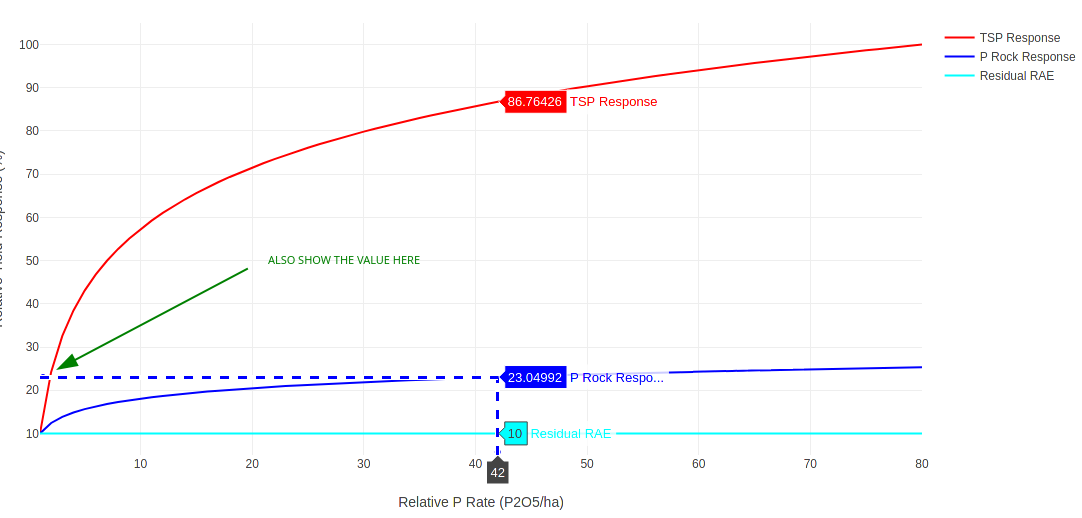
You see that I hovered the blue line and it showed the popups with the value of the red and cyan lines that met the Y axis, I want to show that same popup in the spot that I have drawn the green arrow indicating the value of the dataset when the line of the dataset and the line of the spike crosses in both axis...
Does anyone know a feature that can do that? Is that feasible? I couldn't find anything about that in the documentation of the spikes.
Thank you very much, great tool you guys developed here!
Contributor guide
First steps
- Read the whole issue, then the project's contributing guide.
- Comment on the issue to say you are picking it up — it saves two people doing the same work.
- Fork the repository and make your change on a branch.
- Open a pull request that references the issue number.
Research direction
The issue names no source file, test, or implementation entry point. Begin with the existing spike documentation and the attached example; define how the popup should report both X and Y values at the cross-axis intersection, then verify the behavior across multiple datasets.
Written by the indexing model from the issue text.
Assessment
- Tech stack
- javascript
- Domain
- data-visualization
- Issue type
- Feature
- Difficulty
- 5/5
- Estimated time
- Over a week
- Activity status
- Stale
- Clarity
- Needs clarification
- Newbie friendliness
- 25/100