show the value when the spike and the dataset line crosses in the X axis
Ninguém assumiu esta issue ainda.
- Linguagem predominante
- JavaScript
- Estrelas
- 18.3k
- Forks
- 2k
- Merge médio
- 2d 12h
- PRs com merge (30d)
- 28
Descrição
Sorry, couldn't describe it better in the title, if someone could suggest an edit I'd appreciate.
My point is, when you have multiple datasets and you hover a line, a popup appears in the Y axis of every other line when it crosses the spike line. I'd like to use a feature where it can be shown the popups with the value of both X and Y axis. I'm attaching an image to help to explain my problem:
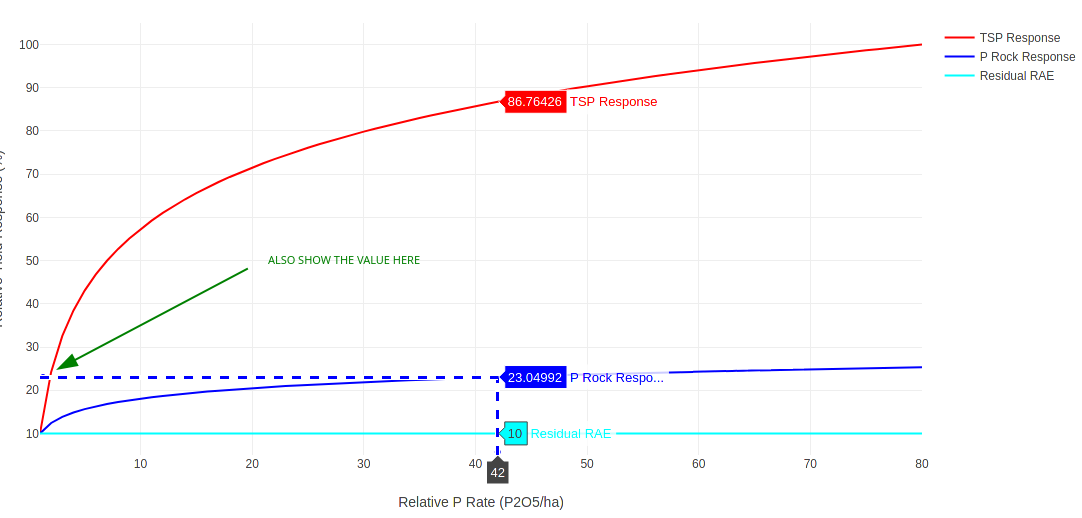
You see that I hovered the blue line and it showed the popups with the value of the red and cyan lines that met the Y axis, I want to show that same popup in the spot that I have drawn the green arrow indicating the value of the dataset when the line of the dataset and the line of the spike crosses in both axis...
Does anyone know a feature that can do that? Is that feasible? I couldn't find anything about that in the documentation of the spikes.
Thank you very much, great tool you guys developed here!
Guia de contribuição
Primeiros passos
- Leia a issue inteira e depois o guia de contribuição do projeto.
- Comente na issue dizendo que vai assumir — evita que duas pessoas façam o mesmo trabalho.
- Faça um fork do repositório e trabalhe em uma branch.
- Abra um pull request que referencie o número da issue.
Direção de pesquisa
A issue não nomeia nenhum arquivo-fonte, teste ou ponto de entrada da implementação. Comece pela documentação existente de spike e pelo exemplo anexado; defina como o popup deve informar os valores X e Y na interseção dos eixos cruzados e, em seguida, verifique o comportamento em vários conjuntos de dados.
Escrita pelo modelo de indexação a partir do texto da issue.
Avaliação
- Stack de tecnologia
- javascript
- Domínio
- data-visualization
- Tipo de issue
- Funcionalidade
- Dificuldade
- 5/5
- Tempo estimado
- Mais de uma semana
- Status de atividade
- Estagnada
- Clareza
- Precisa de esclarecimento
- Facilidade para iniciantes
- 25/100