show the value when the spike and the dataset line crosses in the X axis
Nessuno ha ancora preso questa issue.
- Lingua principale
- JavaScript
- Stelle
- 18.3k
- Fork
- 2k
- Merge medio
- 2g 12h
- PR unite (30g)
- 28
Descrizione
Sorry, couldn't describe it better in the title, if someone could suggest an edit I'd appreciate.
My point is, when you have multiple datasets and you hover a line, a popup appears in the Y axis of every other line when it crosses the spike line. I'd like to use a feature where it can be shown the popups with the value of both X and Y axis. I'm attaching an image to help to explain my problem:
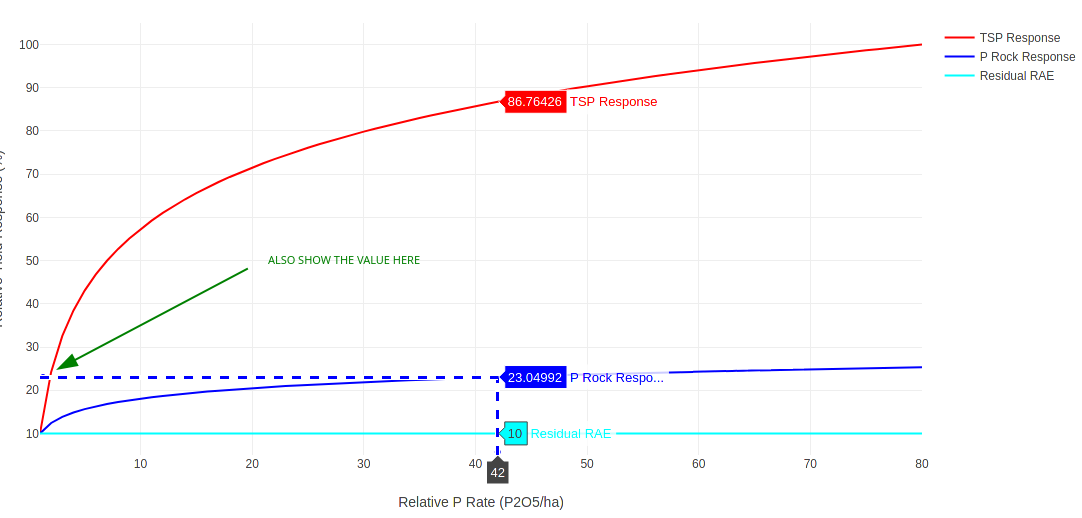
You see that I hovered the blue line and it showed the popups with the value of the red and cyan lines that met the Y axis, I want to show that same popup in the spot that I have drawn the green arrow indicating the value of the dataset when the line of the dataset and the line of the spike crosses in both axis...
Does anyone know a feature that can do that? Is that feasible? I couldn't find anything about that in the documentation of the spikes.
Thank you very much, great tool you guys developed here!
Guida per i contributori
Apri la guida per i contributori
Come iniziare
- Leggi tutta la issue e poi la guida ai contributi del progetto.
- Commenta sulla issue per dire che te ne occupi tu — evita che due persone facciano lo stesso lavoro.
- Fai un fork del repository e lavora su un branch.
- Apri una pull request che faccia riferimento al numero della issue.
Direzione di ricerca
La issue non indica alcun file sorgente, test o punto di ingresso dell’implementazione. Inizia dalla documentazione spike esistente e dall’esempio allegato; definisci come il popup debba riportare entrambi i valori X e Y all’intersezione degli assi incrociati, quindi verifica il comportamento su più dataset.
Scritto dal modello di indicizzazione a partire dal testo della issue.
Valutazione
- Stack tecnologico
- javascript
- Ambito
- data-visualization
- Tipo di issue
- Funzionalità
- Difficoltà
- 5/5
- Tempo stimato
- Più di una settimana
- Stato di attività
- Ferma
- Chiarezza
- Da chiarire
- Idoneità per principianti
- 25/100