show the value when the spike and the dataset line crosses in the X axis
Nadie ha tomado este issue todavía.
- Lenguaje dominante
- JavaScript
- Estrellas
- 18.3k
- Forks
- 2k
- Merge medio
- 2 d 12 h
- PR fusionados (30 d)
- 28
Descripción
Sorry, couldn't describe it better in the title, if someone could suggest an edit I'd appreciate.
My point is, when you have multiple datasets and you hover a line, a popup appears in the Y axis of every other line when it crosses the spike line. I'd like to use a feature where it can be shown the popups with the value of both X and Y axis. I'm attaching an image to help to explain my problem:
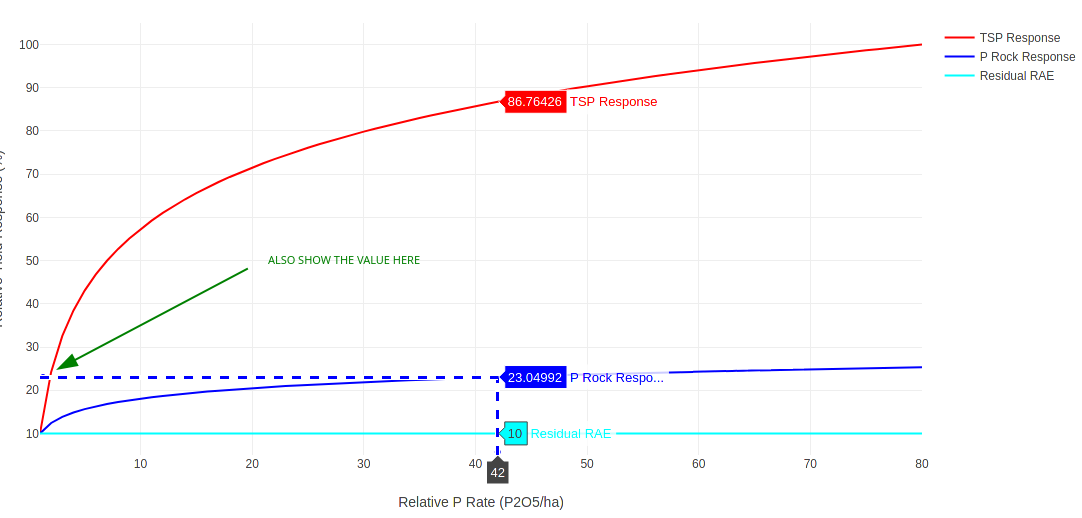
You see that I hovered the blue line and it showed the popups with the value of the red and cyan lines that met the Y axis, I want to show that same popup in the spot that I have drawn the green arrow indicating the value of the dataset when the line of the dataset and the line of the spike crosses in both axis...
Does anyone know a feature that can do that? Is that feasible? I couldn't find anything about that in the documentation of the spikes.
Thank you very much, great tool you guys developed here!
Guía de contribución
Primeros pasos
- Lee el issue completo y luego la guía de contribución del proyecto.
- Comenta en el issue que vas a ocuparte — evita que dos personas hagan lo mismo.
- Haz un fork del repositorio y trabaja en una rama.
- Abre un pull request que haga referencia al número del issue.
Línea de trabajo
El issue no especifica ningún archivo fuente, prueba ni punto de entrada de la implementación. Comienza con la documentación existente de spike y el ejemplo adjunto; define cómo debe informar el popup de los valores X e Y en la intersección de los ejes cruzados y, después, verifica el comportamiento con varios conjuntos de datos.
Escrito por el modelo de indexación a partir del texto del issue.
Evaluación
- Stack tecnológico
- javascript
- Área
- data-visualization
- Tipo de issue
- Nueva funcionalidad
- Dificultad
- 5/5
- Tiempo estimado
- Más de una semana
- Estado de actividad
- Estancado
- Claridad
- Necesita aclaración
- Aptitud para principiantes
- 25/100