Plotly with custom aggregation and crosstalk
オープン
まだ誰も着手していません。
- 主要言語
- R
- スター
- 2.7k
- フォーク
- 641
- PR マージ指標
- 30日以内にマージされた PR はありません
説明
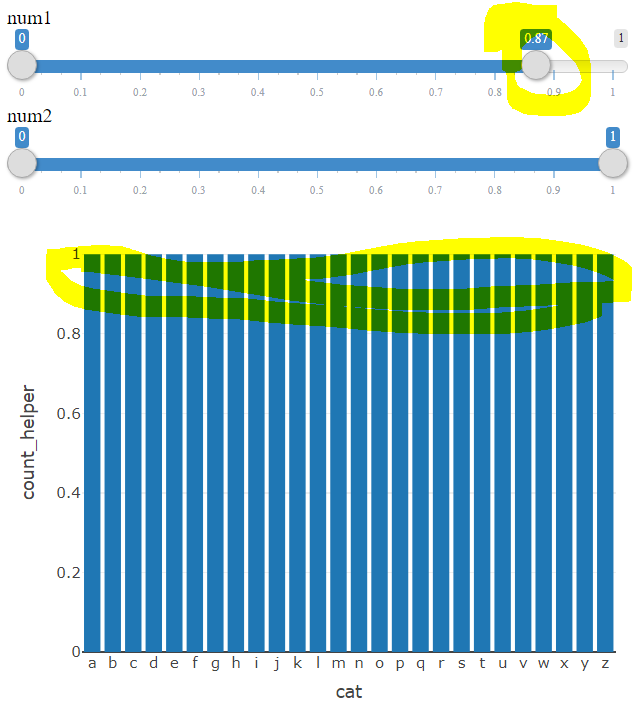
I am having trouble using plotly with custom aggregation and crosstalk. When using the crosstalk's filter, there seems to be some problem with the aggregation. When I set, for example, num1 filter to 0 - 0.87, the distribution starts to be uniform according to the plot which is not true. When using only one slider filter, the problem does not seem to be occurring. Moreover, as a rule of thumb, it seems to me that the more values I am to exclude, the more likely this issue is to happen. Here is a reprex
library(tidyverse)
library(plotly)
library(crosstalk)
library(htmltools)

dat <- tibble(
  cat = sample(letters, size = 12000, replace = T),
  num1 = runif(12000),
  num2 = runif(12000),
  count_helper = 1
)

dat_shared <- highlight_key(dat)


filters <- list(
  filter_slider("num1", "num1", dat_shared, ~num1, round = 2),
  filter_slider("num2", "num2", dat_shared, ~num2, round = 2)
)

p <- dat_shared |>
  plot_ly(
    x = ~cat,
    y = ~count_helper,
    type = 'bar',
    transforms = list(
      list(
        type = 'aggregate',
        groups = ~cat,
        aggregations = list(
          list(
            target = 'y', func = 'count', enabled = T
          )
        )
      )
    )
  )

widget_out <- tagList(
  filters,
  p
)

browsable(widget_out)
コントリビューションガイド
はじめの一歩
- issue を最後まで読み、次にプロジェクトのコントリビューションガイドを読みます。
- 着手することを issue にコメントします — 二人が同じ作業をするのを防げます。
- リポジトリをフォークし、ブランチを切って変更します。
- issue 番号を参照したプルリクエストを送ります。
調査の方向性
提供された R reprex を、両方の crosstalk filter_slider コントロールと、cat および count_helper に対する plot_ly の集約変換を使って実行します。フィルタリングが集約にどのような影響を与えるかを調べます。フィルタリング後の棒が均一に分布するのではなく、実際のカテゴリ数を保持すれば完了です。
索引モデルが issue の本文から書いたものです。
評価
- 技術スタック
- r
- 領域
- data-visualization
- issue の種類
- バグ
- 難易度
- 4/5
- 見積もり時間
- 3〜5日
- 活発さ
- 停滞
- 明瞭さ
- おおむね明確
- 初心者へのやさしさ
- 35/100