Plotly with custom aggregation and crosstalk
未关闭
还没有人认领这个 Issue。
- 主要语言
- R
- 星标
- 2.7k
- 派生
- 641
- PR 合并指标
- 30 天内没有已合并 PR
描述
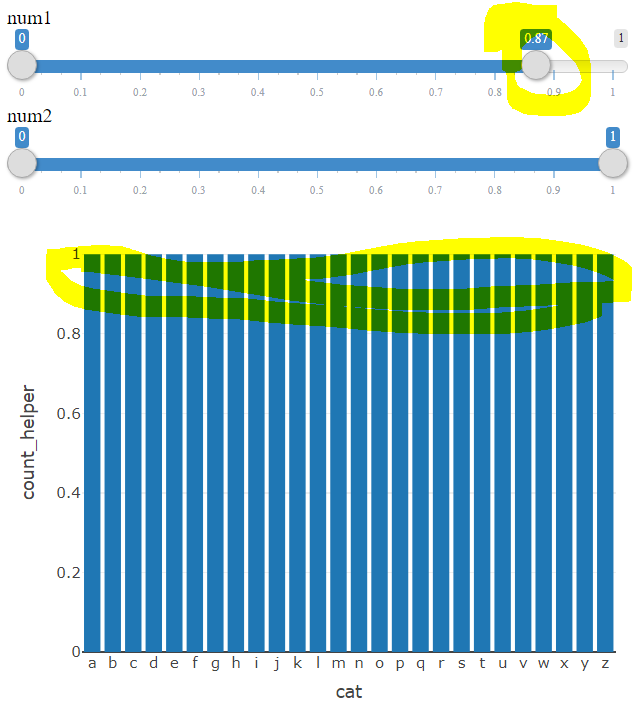
I am having trouble using plotly with custom aggregation and crosstalk. When using the crosstalk's filter, there seems to be some problem with the aggregation. When I set, for example, num1 filter to 0 - 0.87, the distribution starts to be uniform according to the plot which is not true. When using only one slider filter, the problem does not seem to be occurring. Moreover, as a rule of thumb, it seems to me that the more values I am to exclude, the more likely this issue is to happen. Here is a reprex
library(tidyverse)
library(plotly)
library(crosstalk)
library(htmltools)

dat <- tibble(
  cat = sample(letters, size = 12000, replace = T),
  num1 = runif(12000),
  num2 = runif(12000),
  count_helper = 1
)

dat_shared <- highlight_key(dat)


filters <- list(
  filter_slider("num1", "num1", dat_shared, ~num1, round = 2),
  filter_slider("num2", "num2", dat_shared, ~num2, round = 2)
)

p <- dat_shared |>
  plot_ly(
    x = ~cat,
    y = ~count_helper,
    type = 'bar',
    transforms = list(
      list(
        type = 'aggregate',
        groups = ~cat,
        aggregations = list(
          list(
            target = 'y', func = 'count', enabled = T
          )
        )
      )
    )
  )

widget_out <- tagList(
  filters,
  p
)

browsable(widget_out)
贡献指南
从这里开始
- 先读完整个 Issue,再读项目的贡献指南。
- 在 Issue 下留言说明你要接手 —— 这能避免两个人做同样的事。
- Fork 仓库,在一个分支上完成修改。
- 提交 Pull Request,并在描述里引用这个 Issue 编号。
调研方向
运行提供的 R reprex,同时使用两个 crosstalk filter_slider 控件以及对 cat 和 count_helper 执行的 plot_ly 聚合变换。检查过滤如何影响聚合;完成的标准是过滤后的条形保留实际的类别计数,而不是变得均匀分布。
由索引模型根据 Issue 内容生成。
评估
- 技术栈
- r
- 领域
- data-visualization
- Issue 类型
- 缺陷
- 难度
- 4/5
- 预计耗时
- 3-5 天
- 活跃度
- 停滞
- 描述清晰度
- 基本清楚
- 新手友好度
- 35/100