Plotly with custom aggregation and crosstalk
未關閉
還沒有人認領這個 Issue。
- 主要語言
- R
- 星號
- 2.7k
- 分支
- 641
- PR 合併指標
- 30 天內沒有已合併 PR
描述
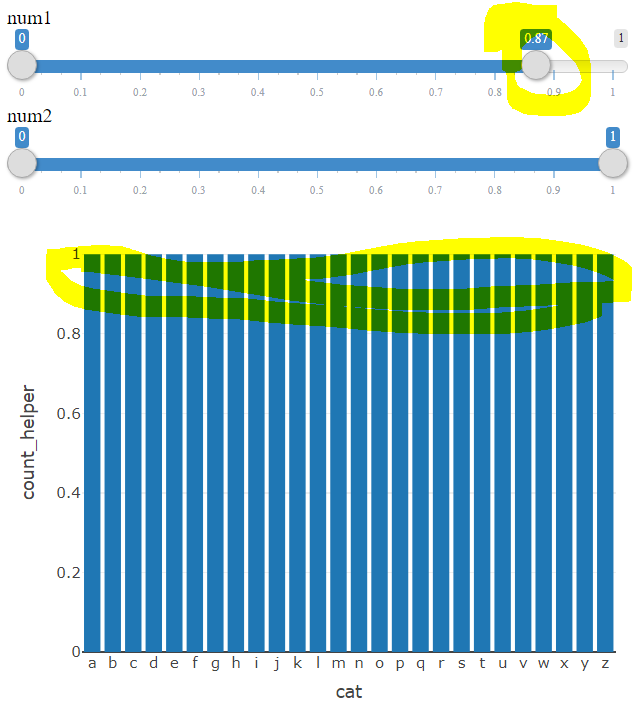
I am having trouble using plotly with custom aggregation and crosstalk. When using the crosstalk's filter, there seems to be some problem with the aggregation. When I set, for example, num1 filter to 0 - 0.87, the distribution starts to be uniform according to the plot which is not true. When using only one slider filter, the problem does not seem to be occurring. Moreover, as a rule of thumb, it seems to me that the more values I am to exclude, the more likely this issue is to happen. Here is a reprex
library(tidyverse)
library(plotly)
library(crosstalk)
library(htmltools)

dat <- tibble(
  cat = sample(letters, size = 12000, replace = T),
  num1 = runif(12000),
  num2 = runif(12000),
  count_helper = 1
)

dat_shared <- highlight_key(dat)


filters <- list(
  filter_slider("num1", "num1", dat_shared, ~num1, round = 2),
  filter_slider("num2", "num2", dat_shared, ~num2, round = 2)
)

p <- dat_shared |>
  plot_ly(
    x = ~cat,
    y = ~count_helper,
    type = 'bar',
    transforms = list(
      list(
        type = 'aggregate',
        groups = ~cat,
        aggregations = list(
          list(
            target = 'y', func = 'count', enabled = T
          )
        )
      )
    )
  )

widget_out <- tagList(
  filters,
  p
)

browsable(widget_out)
貢獻指南
從這裡開始
- 先讀完整個 Issue,再讀專案的貢獻指南。
- 在 Issue 下留言說明你要接手 —— 這能避免兩個人做同樣的事。
- Fork 儲存庫,在一個分支上完成修改。
- 送出 Pull Request,並在描述裡引用這個 Issue 編號。
研究方向
執行提供的 R reprex,同時使用兩個 crosstalk filter_slider 控制項,以及對 cat 和 count_helper 執行的 plot_ly 彙總轉換。檢查篩選如何影響彙總;完成的標準是篩選後的長條保留實際的類別計數,而不是變得均勻分布。
由索引模型根據 Issue 內容生成。
評估
- 技術堆疊
- r
- 領域
- data-visualization
- Issue 類型
- 缺陷
- 難度
- 4/5
- 預估耗時
- 3-5 天
- 活躍度
- 停滯
- 描述清晰度
- 基本清楚
- 新手友好度
- 35/100