geom_GeomGeneArrow() and geom_GeomFitText() has yet to be implemented in plotly [shapviz]
Chưa có ai nhận issue này.
- Ngôn ngữ chính
- R
- Star
- 2.7k
- Fork
- 641
- Chỉ số merge pull request
- Không có pull request nào được merge trong 30 ngày
Mô tả
Recently I started working with the new shapviz package. In particular, the waterfall plot was working just fine for what I needed to visualise. Unfortunately, I was unable to use ggplotly to render the plots in plotly.

As it turns out, the waterfall plot is different from plotly's waterfall chart as it is built on the GeomGeneArrow geom from
from https://github.com/wilkox/gggenes.
Warning message in geom2trace.default(dots[[1L]][[1L]], dots[[2L]][[1L]], dots[[3L]][[1L]]):
“geom_GeomGeneArrow() has yet to be implemented in plotly.
  If you'd like to see this geom implemented,
  Please open an issue with your example code at
  [https://github.com/ropensci/plotly/issues](https://github.com/ropensci/plotly/issues)
In addition, geom_GeomFitText, which is needed for rendering text over plot elements is also unimplemented.
geom_GeomFitText() has yet to be implemented in plotly.
  If you'd like to see this geom implemented,
  Please open an issue with your example code at
  [https://github.com/ropensci/plotly/issues](https://github.com/ropensci/plotly/issues)
Reprex adapted from the default shapviz example below:
#library imports
install.packages("shapviz")
library(shapviz)
library(ggplot2)
library(xgboost)

set.seed(3653)

X <- diamonds[c("carat", "cut", "color", "clarity")]
dtrain <- xgb.DMatrix(data.matrix(X), label = diamonds$price)

fit <- xgb.train(
  params = list(learning_rate = 0.1, objective = "reg:squarederror"),
  data = dtrain,
  nrounds = 65L
)

X_small <- X[sample(nrow(X), 2000L), ]

shp <- shapviz(fit, X_pred = data.matrix(X_small), X = X_small)
waterfall_plot <- sv_waterfall(shp, row_id = 1)

library(plotly)
ggplotly(waterfall_plot)
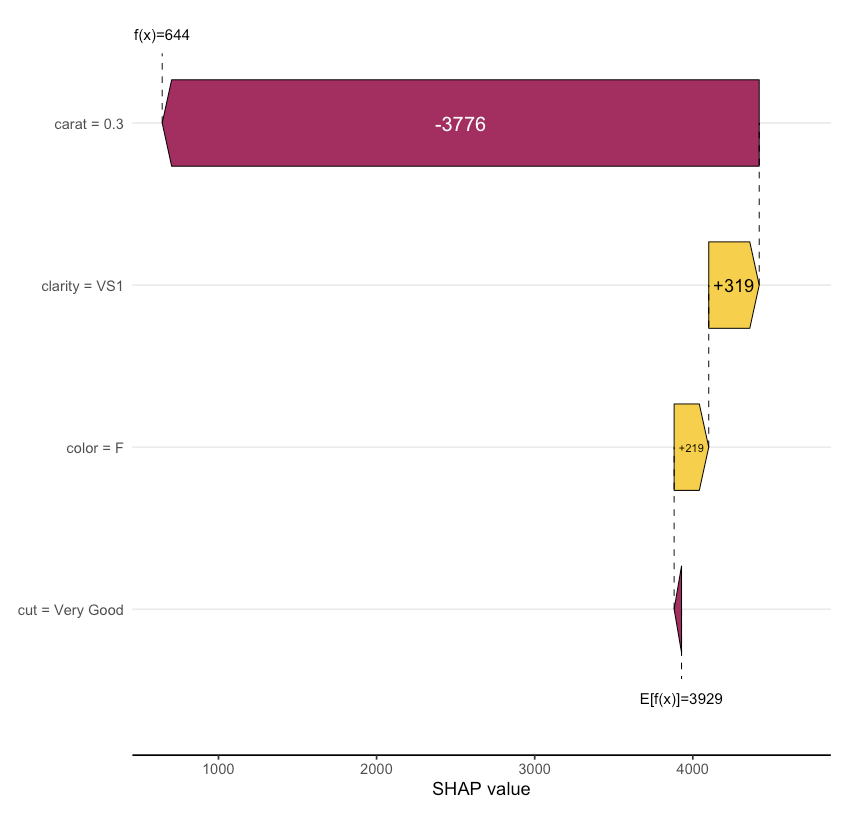
Expected Output should render similar to this (original ggplot):
Hướng dẫn đóng góp
Bắt đầu từ đâu
- Đọc hết issue, rồi đọc hướng dẫn đóng góp của dự án.
- Bình luận trên issue rằng bạn sẽ nhận — tránh hai người làm cùng một việc.
- Fork repository và làm thay đổi trên một nhánh.
- Mở pull request có tham chiếu số hiệu của issue.
Hướng nghiên cứu
Bắt đầu bằng cách chạy reprex R được cung cấp qua ggplotly(waterfall_plot) và kiểm tra các cảnh báo geom2trace.default cho GeomGeneArrow và GeomFitText. So sánh hành vi với gggenes/R/geom_gene_arrow.R và tài liệu tham chiếu geom của ggfittext; được coi là hoàn tất khi biểu đồ waterfall của shapviz được kết xuất qua ggplotly mà không có cảnh báo geom chưa được triển khai nào.
Do mô hình lập chỉ mục viết ra từ nội dung của issue.
Đánh giá
- Công nghệ
- r
- Lĩnh vực
- data-visualization
- Loại issue
- Tính năng
- Độ khó
- 5/5
- Thời gian dự kiến
- Hơn một tuần
- Mức độ hoạt động
- Đình trệ
- Độ rõ ràng
- Khá rõ ràng
- Mức phù hợp với người mới
- 25/100