geom_GeomGeneArrow() and geom_GeomFitText() has yet to be implemented in plotly [shapviz]
Personne n'a encore pris cette issue.
- Langage dominant
- R
- Étoiles
- 2.7k
- Forks
- 641
- Métriques de merge des PR
- Aucune PR mergée en 30 j
Description
Recently I started working with the new shapviz package. In particular, the waterfall plot was working just fine for what I needed to visualise. Unfortunately, I was unable to use ggplotly to render the plots in plotly.

As it turns out, the waterfall plot is different from plotly's waterfall chart as it is built on the GeomGeneArrow geom from
from https://github.com/wilkox/gggenes.
Warning message in geom2trace.default(dots[[1L]][[1L]], dots[[2L]][[1L]], dots[[3L]][[1L]]):
“geom_GeomGeneArrow() has yet to be implemented in plotly.
  If you'd like to see this geom implemented,
  Please open an issue with your example code at
  [https://github.com/ropensci/plotly/issues](https://github.com/ropensci/plotly/issues)
In addition, geom_GeomFitText, which is needed for rendering text over plot elements is also unimplemented.
geom_GeomFitText() has yet to be implemented in plotly.
  If you'd like to see this geom implemented,
  Please open an issue with your example code at
  [https://github.com/ropensci/plotly/issues](https://github.com/ropensci/plotly/issues)
Reprex adapted from the default shapviz example below:
#library imports
install.packages("shapviz")
library(shapviz)
library(ggplot2)
library(xgboost)

set.seed(3653)

X <- diamonds[c("carat", "cut", "color", "clarity")]
dtrain <- xgb.DMatrix(data.matrix(X), label = diamonds$price)

fit <- xgb.train(
  params = list(learning_rate = 0.1, objective = "reg:squarederror"),
  data = dtrain,
  nrounds = 65L
)

X_small <- X[sample(nrow(X), 2000L), ]

shp <- shapviz(fit, X_pred = data.matrix(X_small), X = X_small)
waterfall_plot <- sv_waterfall(shp, row_id = 1)

library(plotly)
ggplotly(waterfall_plot)
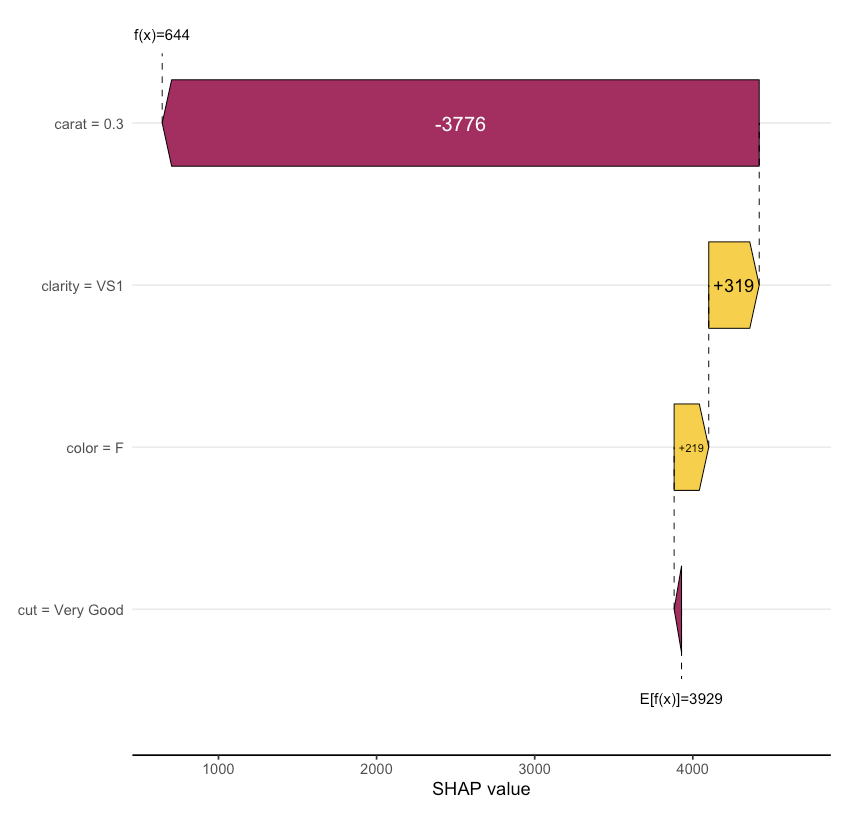
Expected Output should render similar to this (original ggplot):
Guide de contribution
Ouvrir le guide de contribution
Par où commencer
- Lisez l'issue en entier, puis le guide de contribution du projet.
- Signalez en commentaire que vous la prenez — cela évite que deux personnes fassent le même travail.
- Forkez le dépôt et travaillez sur une branche.
- Ouvrez une pull request qui référence le numéro de l'issue.
Piste de recherche
Commencez par exécuter le reprex R fourni via ggplotly(waterfall_plot) et examinez les avertissements de geom2trace.default pour GeomGeneArrow et GeomFitText. Comparez le comportement avec gggenes/R/geom_gene_arrow.R et la référence des geoms de ggfittext ; c’est terminé lorsque le graphique en cascade de shapviz est rendu via ggplotly sans aucun avertissement de geom non implémenté.
Rédigé par le modèle d'indexation à partir du texte de l'issue.
Évaluation
- Stack technique
- r
- Domaine
- data-visualization
- Type d'issue
- Fonctionnalité
- Difficulté
- 5/5
- Temps estimé
- Plus d'une semaine
- Activité
- À l'abandon
- Clarté
- Plutôt claire
- Accessibilité débutants
- 25/100