geom_GeomGeneArrow() and geom_GeomFitText() has yet to be implemented in plotly [shapviz]
Ninguém assumiu esta issue ainda.
- Linguagem predominante
- R
- Estrelas
- 2.7k
- Forks
- 641
- Métricas de merge de PRs
- Nenhum PR com merge em 30d
Descrição
Recently I started working with the new shapviz package. In particular, the waterfall plot was working just fine for what I needed to visualise. Unfortunately, I was unable to use ggplotly to render the plots in plotly.

As it turns out, the waterfall plot is different from plotly's waterfall chart as it is built on the GeomGeneArrow geom from
from https://github.com/wilkox/gggenes.
Warning message in geom2trace.default(dots[[1L]][[1L]], dots[[2L]][[1L]], dots[[3L]][[1L]]):
“geom_GeomGeneArrow() has yet to be implemented in plotly.
  If you'd like to see this geom implemented,
  Please open an issue with your example code at
  [https://github.com/ropensci/plotly/issues](https://github.com/ropensci/plotly/issues)
In addition, geom_GeomFitText, which is needed for rendering text over plot elements is also unimplemented.
geom_GeomFitText() has yet to be implemented in plotly.
  If you'd like to see this geom implemented,
  Please open an issue with your example code at
  [https://github.com/ropensci/plotly/issues](https://github.com/ropensci/plotly/issues)
Reprex adapted from the default shapviz example below:
#library imports
install.packages("shapviz")
library(shapviz)
library(ggplot2)
library(xgboost)

set.seed(3653)

X <- diamonds[c("carat", "cut", "color", "clarity")]
dtrain <- xgb.DMatrix(data.matrix(X), label = diamonds$price)

fit <- xgb.train(
  params = list(learning_rate = 0.1, objective = "reg:squarederror"),
  data = dtrain,
  nrounds = 65L
)

X_small <- X[sample(nrow(X), 2000L), ]

shp <- shapviz(fit, X_pred = data.matrix(X_small), X = X_small)
waterfall_plot <- sv_waterfall(shp, row_id = 1)

library(plotly)
ggplotly(waterfall_plot)
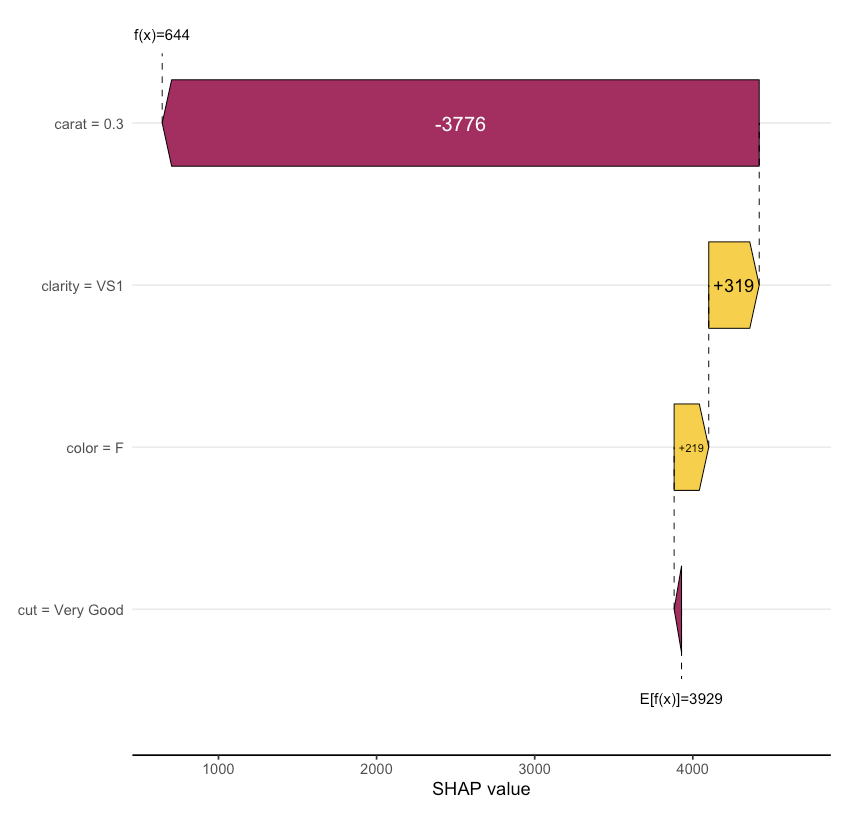
Expected Output should render similar to this (original ggplot):
Guia de contribuição
Primeiros passos
- Leia a issue inteira e depois o guia de contribuição do projeto.
- Comente na issue dizendo que vai assumir — evita que duas pessoas façam o mesmo trabalho.
- Faça um fork do repositório e trabalhe em uma branch.
- Abra um pull request que referencie o número da issue.
Direção de pesquisa
Comece executando o reprex R fornecido por meio de ggplotly(waterfall_plot) e inspecione os avisos de geom2trace.default para GeomGeneArrow e GeomFitText. Compare o comportamento com gggenes/R/geom_gene_arrow.R e a referência de geoms do ggfittext; considera-se concluído quando o gráfico waterfall do shapviz é renderizado por meio de ggplotly sem nenhum aviso de geom não implementado.
Escrita pelo modelo de indexação a partir do texto da issue.
Avaliação
- Stack de tecnologia
- r
- Domínio
- data-visualization
- Tipo de issue
- Funcionalidade
- Dificuldade
- 5/5
- Tempo estimado
- Mais de uma semana
- Status de atividade
- Estagnada
- Clareza
- Razoavelmente clara
- Facilidade para iniciantes
- 25/100