geom_GeomGeneArrow() and geom_GeomFitText() has yet to be implemented in plotly [shapviz]
Nadie ha tomado este issue todavía.
- Lenguaje dominante
- R
- Estrellas
- 2.7k
- Forks
- 641
- Métricas de merge de PR
- Sin PR fusionados en 30 d
Descripción
Recently I started working with the new shapviz package. In particular, the waterfall plot was working just fine for what I needed to visualise. Unfortunately, I was unable to use ggplotly to render the plots in plotly.

As it turns out, the waterfall plot is different from plotly's waterfall chart as it is built on the GeomGeneArrow geom from
from https://github.com/wilkox/gggenes.
Warning message in geom2trace.default(dots[[1L]][[1L]], dots[[2L]][[1L]], dots[[3L]][[1L]]):
“geom_GeomGeneArrow() has yet to be implemented in plotly.
  If you'd like to see this geom implemented,
  Please open an issue with your example code at
  [https://github.com/ropensci/plotly/issues](https://github.com/ropensci/plotly/issues)
In addition, geom_GeomFitText, which is needed for rendering text over plot elements is also unimplemented.
geom_GeomFitText() has yet to be implemented in plotly.
  If you'd like to see this geom implemented,
  Please open an issue with your example code at
  [https://github.com/ropensci/plotly/issues](https://github.com/ropensci/plotly/issues)
Reprex adapted from the default shapviz example below:
#library imports
install.packages("shapviz")
library(shapviz)
library(ggplot2)
library(xgboost)

set.seed(3653)

X <- diamonds[c("carat", "cut", "color", "clarity")]
dtrain <- xgb.DMatrix(data.matrix(X), label = diamonds$price)

fit <- xgb.train(
  params = list(learning_rate = 0.1, objective = "reg:squarederror"),
  data = dtrain,
  nrounds = 65L
)

X_small <- X[sample(nrow(X), 2000L), ]

shp <- shapviz(fit, X_pred = data.matrix(X_small), X = X_small)
waterfall_plot <- sv_waterfall(shp, row_id = 1)

library(plotly)
ggplotly(waterfall_plot)
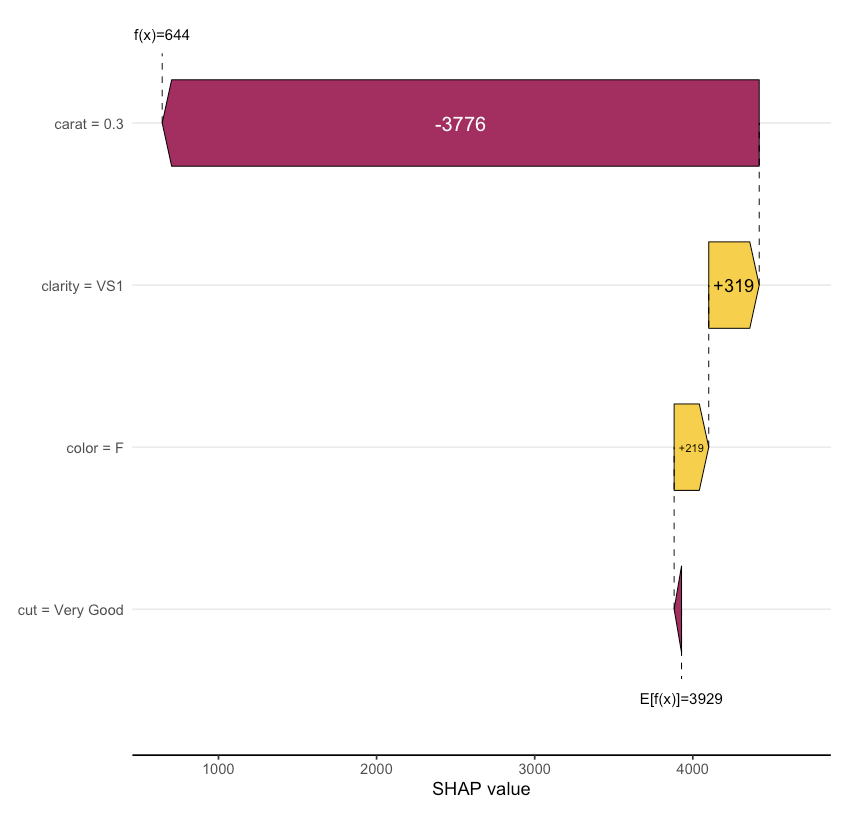
Expected Output should render similar to this (original ggplot):
Guía de contribución
Primeros pasos
- Lee el issue completo y luego la guía de contribución del proyecto.
- Comenta en el issue que vas a ocuparte — evita que dos personas hagan lo mismo.
- Haz un fork del repositorio y trabaja en una rama.
- Abre un pull request que haga referencia al número del issue.
Línea de trabajo
Comienza ejecutando el reprex de R proporcionado mediante ggplotly(waterfall_plot) e inspecciona las advertencias de geom2trace.default para GeomGeneArrow y GeomFitText. Compara el comportamiento con gggenes/R/geom_gene_arrow.R y la referencia de geoms de ggfittext; se considera terminado cuando el gráfico de cascada de shapviz se renderiza mediante ggplotly sin ninguna advertencia de geom no implementado.
Escrito por el modelo de indexación a partir del texto del issue.
Evaluación
- Stack tecnológico
- r
- Área
- data-visualization
- Tipo de issue
- Nueva funcionalidad
- Dificultad
- 5/5
- Tiempo estimado
- Más de una semana
- Estado de actividad
- Estancado
- Claridad
- Bastante claro
- Aptitud para principiantes
- 25/100