geom_GeomGeneArrow() and geom_GeomFitText() has yet to be implemented in plotly [shapviz]
Nessuno ha ancora preso questa issue.
- Lingua principale
- R
- Stelle
- 2.7k
- Fork
- 641
- Metriche di merge delle PR
- Nessuna PR unita negli ultimi 30g
Descrizione
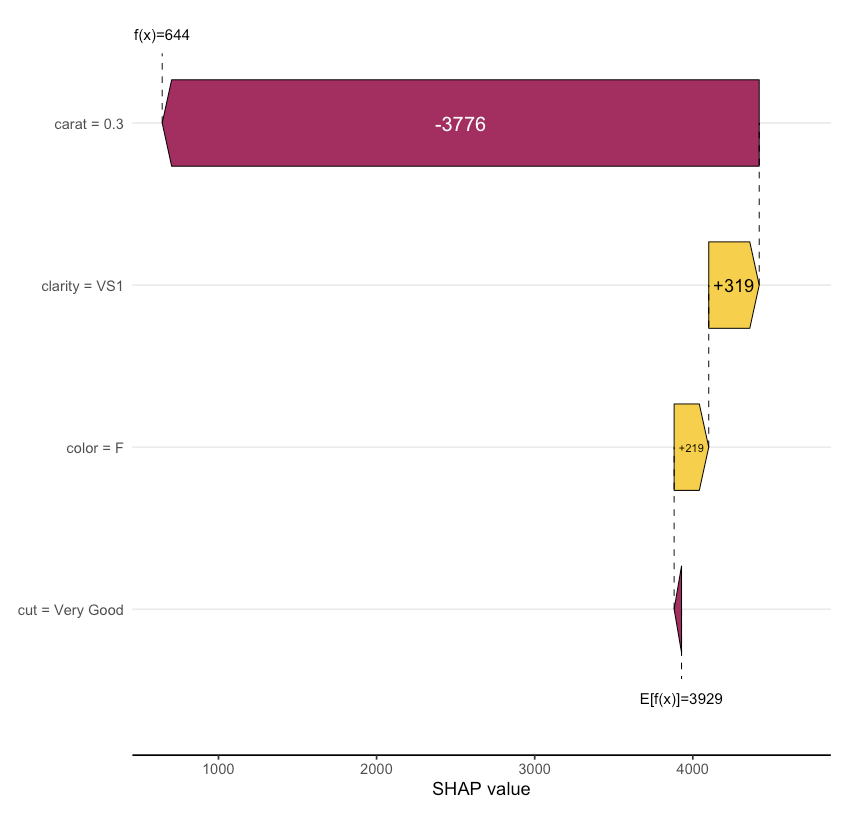
Recently I started working with the new shapviz package. In particular, the waterfall plot was working just fine for what I needed to visualise. Unfortunately, I was unable to use ggplotly to render the plots in plotly.

As it turns out, the waterfall plot is different from plotly's waterfall chart as it is built on the GeomGeneArrow geom from
from https://github.com/wilkox/gggenes.
Warning message in geom2trace.default(dots[[1L]][[1L]], dots[[2L]][[1L]], dots[[3L]][[1L]]):
“geom_GeomGeneArrow() has yet to be implemented in plotly.
  If you'd like to see this geom implemented,
  Please open an issue with your example code at
  [https://github.com/ropensci/plotly/issues](https://github.com/ropensci/plotly/issues)
In addition, geom_GeomFitText, which is needed for rendering text over plot elements is also unimplemented.
geom_GeomFitText() has yet to be implemented in plotly.
  If you'd like to see this geom implemented,
  Please open an issue with your example code at
  [https://github.com/ropensci/plotly/issues](https://github.com/ropensci/plotly/issues)
Reprex adapted from the default shapviz example below:
#library imports
install.packages("shapviz")
library(shapviz)
library(ggplot2)
library(xgboost)

set.seed(3653)

X <- diamonds[c("carat", "cut", "color", "clarity")]
dtrain <- xgb.DMatrix(data.matrix(X), label = diamonds$price)

fit <- xgb.train(
  params = list(learning_rate = 0.1, objective = "reg:squarederror"),
  data = dtrain,
  nrounds = 65L
)

X_small <- X[sample(nrow(X), 2000L), ]

shp <- shapviz(fit, X_pred = data.matrix(X_small), X = X_small)
waterfall_plot <- sv_waterfall(shp, row_id = 1)

library(plotly)
ggplotly(waterfall_plot)
Expected Output should render similar to this (original ggplot):
Guida per i contributori
Apri la guida per i contributori
Come iniziare
- Leggi tutta la issue e poi la guida ai contributi del progetto.
- Commenta sulla issue per dire che te ne occupi tu — evita che due persone facciano lo stesso lavoro.
- Fai un fork del repository e lavora su un branch.
- Apri una pull request che faccia riferimento al numero della issue.
Direzione di ricerca
Inizia eseguendo il reprex R fornito tramite ggplotly(waterfall_plot) e ispeziona gli avvisi di geom2trace.default per GeomGeneArrow e GeomFitText. Confronta il comportamento con gggenes/R/geom_gene_arrow.R e il riferimento alle geom di ggfittext; il lavoro è completato quando il grafico waterfall di shapviz viene renderizzato tramite ggplotly senza alcun avviso di geom non implementata.
Scritto dal modello di indicizzazione a partire dal testo della issue.
Valutazione
- Stack tecnologico
- r
- Ambito
- data-visualization
- Tipo di issue
- Funzionalità
- Difficoltà
- 5/5
- Tempo stimato
- Più di una settimana
- Stato di attività
- Ferma
- Chiarezza
- Abbastanza chiara
- Idoneità per principianti
- 25/100