geom_GeomGeneArrow() and geom_GeomFitText() has yet to be implemented in plotly [shapviz]
Dieses Issue hat noch niemand übernommen.
- Vorherrschende Sprache
- R
- Sterne
- 2.7k
- Forks
- 641
- PR-Merge-Kennzahlen
- Keine gemergten PRs in 30 T.
Beschreibung
Recently I started working with the new shapviz package. In particular, the waterfall plot was working just fine for what I needed to visualise. Unfortunately, I was unable to use ggplotly to render the plots in plotly.

As it turns out, the waterfall plot is different from plotly's waterfall chart as it is built on the GeomGeneArrow geom from
from https://github.com/wilkox/gggenes.
Warning message in geom2trace.default(dots[[1L]][[1L]], dots[[2L]][[1L]], dots[[3L]][[1L]]):
“geom_GeomGeneArrow() has yet to be implemented in plotly.
  If you'd like to see this geom implemented,
  Please open an issue with your example code at
  [https://github.com/ropensci/plotly/issues](https://github.com/ropensci/plotly/issues)
In addition, geom_GeomFitText, which is needed for rendering text over plot elements is also unimplemented.
geom_GeomFitText() has yet to be implemented in plotly.
  If you'd like to see this geom implemented,
  Please open an issue with your example code at
  [https://github.com/ropensci/plotly/issues](https://github.com/ropensci/plotly/issues)
Reprex adapted from the default shapviz example below:
#library imports
install.packages("shapviz")
library(shapviz)
library(ggplot2)
library(xgboost)

set.seed(3653)

X <- diamonds[c("carat", "cut", "color", "clarity")]
dtrain <- xgb.DMatrix(data.matrix(X), label = diamonds$price)

fit <- xgb.train(
  params = list(learning_rate = 0.1, objective = "reg:squarederror"),
  data = dtrain,
  nrounds = 65L
)

X_small <- X[sample(nrow(X), 2000L), ]

shp <- shapviz(fit, X_pred = data.matrix(X_small), X = X_small)
waterfall_plot <- sv_waterfall(shp, row_id = 1)

library(plotly)
ggplotly(waterfall_plot)
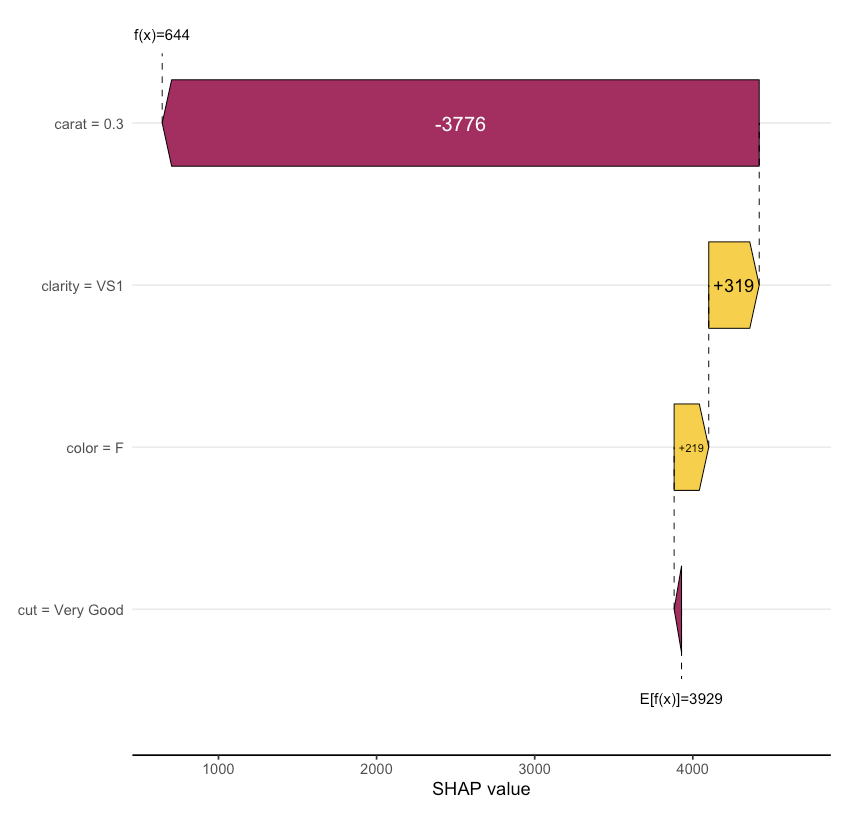
Expected Output should render similar to this (original ggplot):
Beitragsleitfaden
Erste Schritte
- Lies das ganze Issue und danach den Beitragsleitfaden des Projekts.
- Schreib ins Issue, dass du es übernimmst — das erspart doppelte Arbeit.
- Forke das Repository und arbeite in einem Branch.
- Öffne einen Pull Request, der die Issue-Nummer nennt.
Rechercherichtung
Beginnen Sie damit, das bereitgestellte R-reprex durch ggplotly(waterfall_plot) laufen zu lassen und die geom2trace.default-Warnungen für GeomGeneArrow und GeomFitText zu untersuchen. Vergleichen Sie das Verhalten mit gggenes/R/geom_gene_arrow.R und der ggfittext-Geom-Referenz; als erledigt gilt die Aufgabe, wenn der shapviz-Wasserfallplot durch ggplotly gerendert wird, ohne dass eine der Warnungen zu nicht implementierten Geoms ausgegeben wird.
Vom Indexierungsmodell aus dem Issue-Text verfasst.
Bewertung
- Tech-Stack
- r
- Bereich
- data-visualization
- Issue-Typ
- Feature
- Schwierigkeit
- 5/5
- Geschätzter Aufwand
- Über eine Woche
- Aktivitätsstatus
- Veraltet
- Klarheit
- Größtenteils klar
- Anfängerfreundlichkeit
- 25/100