geom_GeomGeneArrow() and geom_GeomFitText() has yet to be implemented in plotly [shapviz]
Nobody has claimed this yet.
- Dominant language
- R
- Stars
- 2.7k
- Forks
- 641
- PR merge metrics
- No merged PRs in 30d
Description
Recently I started working with the new shapviz package. In particular, the waterfall plot was working just fine for what I needed to visualise. Unfortunately, I was unable to use ggplotly to render the plots in plotly.

As it turns out, the waterfall plot is different from plotly's waterfall chart as it is built on the GeomGeneArrow geom from
from https://github.com/wilkox/gggenes.
Warning message in geom2trace.default(dots[[1L]][[1L]], dots[[2L]][[1L]], dots[[3L]][[1L]]):
“geom_GeomGeneArrow() has yet to be implemented in plotly.
  If you'd like to see this geom implemented,
  Please open an issue with your example code at
  [https://github.com/ropensci/plotly/issues](https://github.com/ropensci/plotly/issues)
In addition, geom_GeomFitText, which is needed for rendering text over plot elements is also unimplemented.
geom_GeomFitText() has yet to be implemented in plotly.
  If you'd like to see this geom implemented,
  Please open an issue with your example code at
  [https://github.com/ropensci/plotly/issues](https://github.com/ropensci/plotly/issues)
Reprex adapted from the default shapviz example below:
#library imports
install.packages("shapviz")
library(shapviz)
library(ggplot2)
library(xgboost)

set.seed(3653)

X <- diamonds[c("carat", "cut", "color", "clarity")]
dtrain <- xgb.DMatrix(data.matrix(X), label = diamonds$price)

fit <- xgb.train(
  params = list(learning_rate = 0.1, objective = "reg:squarederror"),
  data = dtrain,
  nrounds = 65L
)

X_small <- X[sample(nrow(X), 2000L), ]

shp <- shapviz(fit, X_pred = data.matrix(X_small), X = X_small)
waterfall_plot <- sv_waterfall(shp, row_id = 1)

library(plotly)
ggplotly(waterfall_plot)
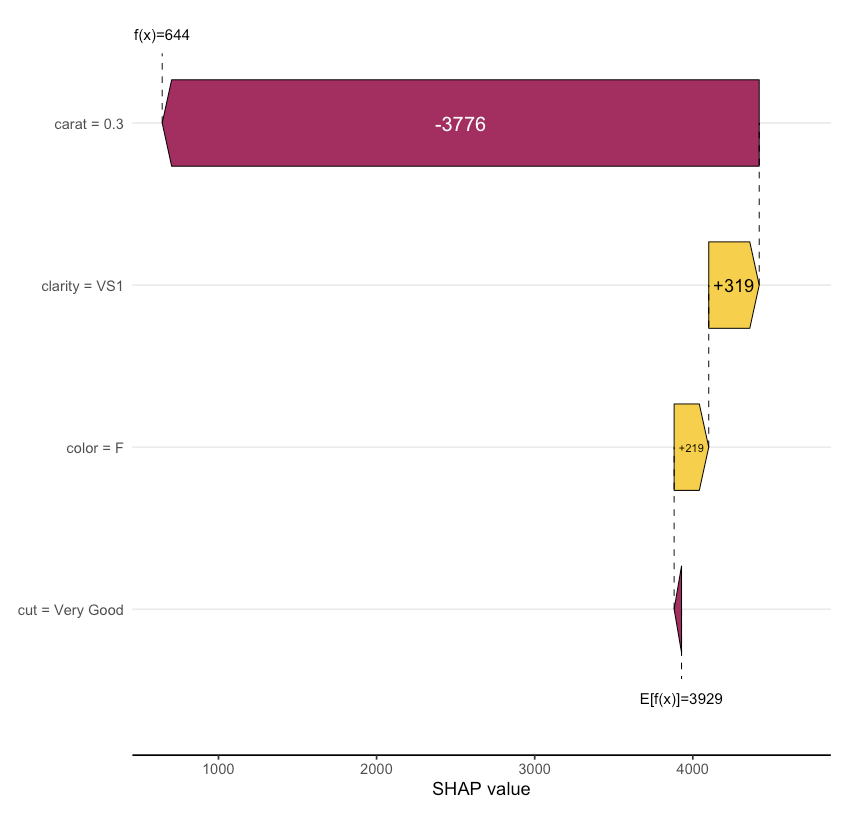
Expected Output should render similar to this (original ggplot):
Contributor guide
First steps
- Read the whole issue, then the project's contributing guide.
- Comment on the issue to say you are picking it up — it saves two people doing the same work.
- Fork the repository and make your change on a branch.
- Open a pull request that references the issue number.
Research direction
Start by running the supplied R reprex through ggplotly(waterfall_plot) and inspect the geom2trace.default warnings for GeomGeneArrow and GeomFitText. Compare the behavior with gggenes/R/geom_gene_arrow.R and the ggfittext geom reference; done means the shapviz waterfall plot renders through ggplotly without either unimplemented-geom warning.
Written by the indexing model from the issue text.
Assessment
- Tech stack
- r
- Domain
- data-visualization
- Issue type
- Feature
- Difficulty
- 5/5
- Estimated time
- Over a week
- Activity status
- Stale
- Clarity
- Mostly clear
- Newbie friendliness
- 25/100