Automargins cause imshow figure to jump around and change pixel size and labels spacing
Chưa có ai nhận issue này.
- Ngôn ngữ chính
- Python
- Star
- 18.8k
- Fork
- 2.8k
- Merge trung bình
- 16 giờ 26 phút
- Pull request đã merge (30 ngày)
- 21
Mô tả
I wasn't sure if this was a bug initially so I provided a reproducible example and closer description in the forum.
Briefly, with automargin=False, heatmaps of different figure sizes have the same pixel size:

Setting automargin=True creates figures with widely different pixel sizes and shifts where the figure appear and its whitespace (with more than just the label length):
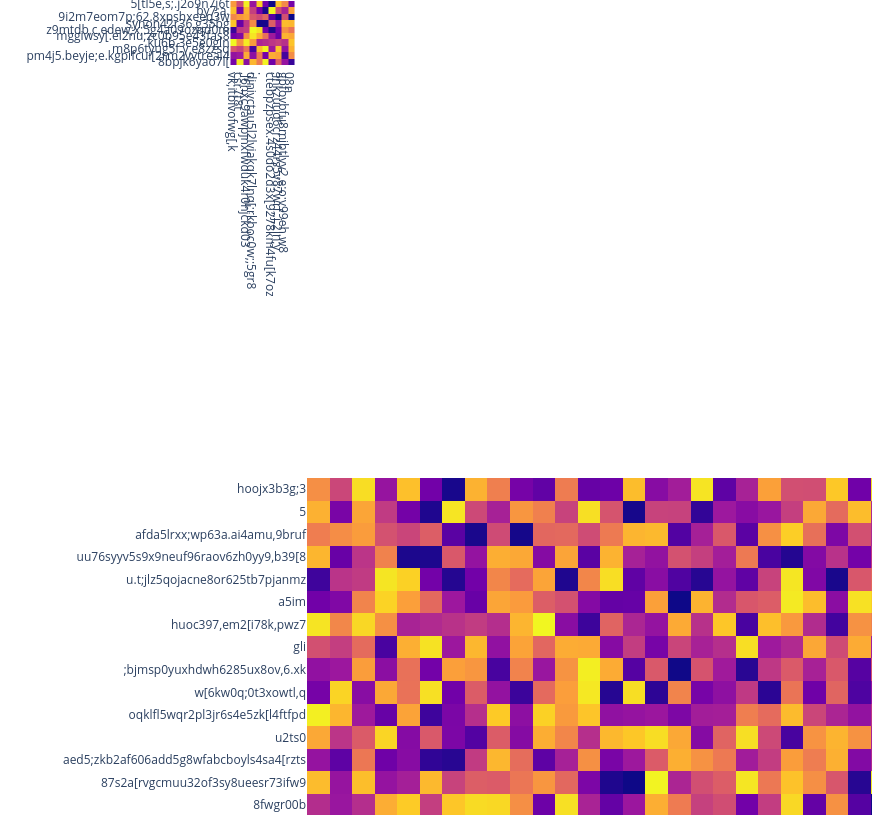
The jumping around behavior and inconsistent pixel sizes both seem to come from a bug in how the automargins are calculated or applied. A workaround is to set automargin=False and then manually specifying how much space is needed for the labels in the margin dictionary, e.g. margin=dict(t=100, b=0, l=80, r=0) and pad the overall figure size with these numbers, e.g. height = 100 + cut * 30.
It seems like the automargins are not correctly adding their label padding to the overall figure size, so that would be my suggestion for what could be a possible solution here.
Example code:
import plotly.express as px
import numpy as np
import pandas as pd


np.random.seed(20934)
img = np.random.rand(200, 200)
for cut in [10, 50]:
    fig = px.imshow(
        img[:cut, :cut],
        height=cut * 30,
        width=cut * 30,
        x = [''.join(np.random.choice(list('qwertyuioplkjhgfdsazxcvbnm,.;[098765432'), np.random.choice(40))) for x in range(cut)],
        y = [''.join(np.random.choice(list('qwertyuioplkjhgfdsazxcvbnm,.;[098765432'), np.random.choice(40))) for x in range(cut)],

    )
    fig.update_layout(
        coloraxis_showscale=False,
        margin=dict(t=0, b=0, l=0, r=0),
        xaxis_nticks=cut + 1,
        yaxis_nticks=cut + 1,
    ).update_xaxes(
        automargin=False,
    ).update_yaxes(
        automargin=False,
    )
    fig.show()
Hướng dẫn đóng góp
Bắt đầu từ đâu
- Đọc hết issue, rồi đọc hướng dẫn đóng góp của dự án.
- Bình luận trên issue rằng bạn sẽ nhận — tránh hai người làm cùng một việc.
- Fork repository và làm thay đổi trên một nhánh.
- Mở pull request có tham chiếu số hiệu của issue.
Hướng nghiên cứu
Bắt đầu với bản tái hiện Python px.imshow được cung cấp, so sánh automargin=True với cách khắc phục bằng lề thủ công và kiểm tra hành vi automargin của các trục x và y. Theo dõi phép tính hoặc việc áp dụng automargin được update_xaxes và update_yaxes sử dụng. Được xem là hoàn tất khi các heatmap có kích thước khác nhau vẫn giữ được kích thước pixel, vị trí và khoảng cách nhãn nhất quán mà không cần lề thủ công.
Do mô hình lập chỉ mục viết ra từ nội dung của issue.
Đánh giá
- Công nghệ
- python
- Lĩnh vực
- data-visualization
- Loại issue
- Lỗi
- Độ khó
- 4/5
- Thời gian dự kiến
- 3-5 ngày
- Mức độ hoạt động
- Đình trệ
- Độ rõ ràng
- Khá rõ ràng
- Mức phù hợp với người mới
- 35/100