Automargins cause imshow figure to jump around and change pixel size and labels spacing
Nessuno ha ancora preso questa issue.
- Lingua principale
- Python
- Stelle
- 18.8k
- Fork
- 2.8k
- Merge medio
- 16h 26m
- PR unite (30g)
- 21
Descrizione
I wasn't sure if this was a bug initially so I provided a reproducible example and closer description in the forum.
Briefly, with automargin=False, heatmaps of different figure sizes have the same pixel size:

Setting automargin=True creates figures with widely different pixel sizes and shifts where the figure appear and its whitespace (with more than just the label length):
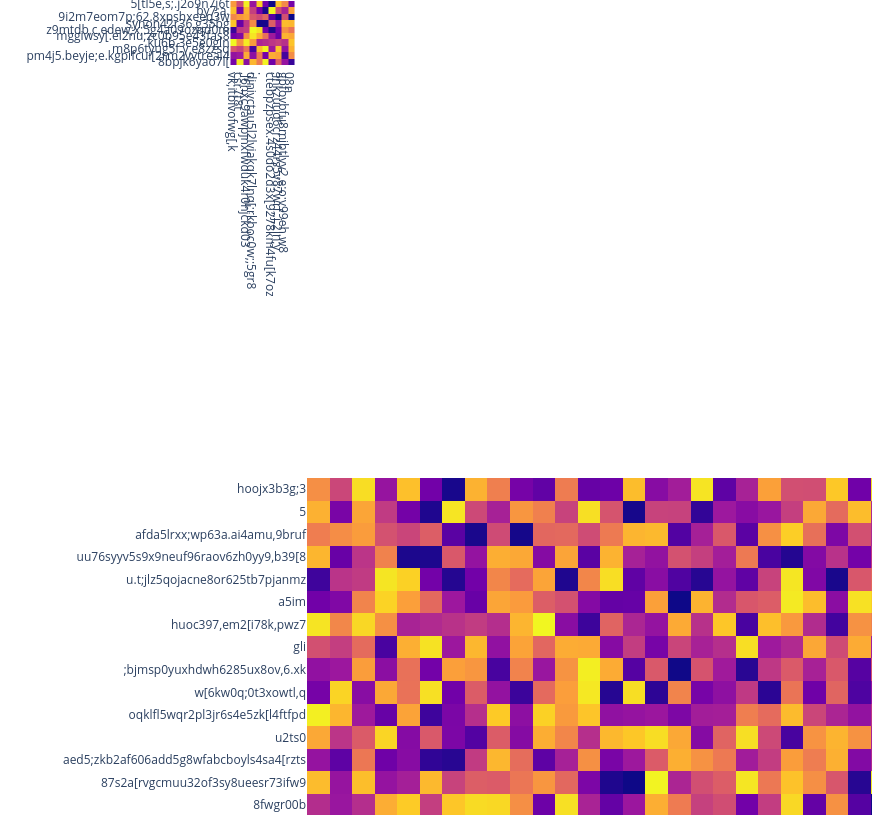
The jumping around behavior and inconsistent pixel sizes both seem to come from a bug in how the automargins are calculated or applied. A workaround is to set automargin=False and then manually specifying how much space is needed for the labels in the margin dictionary, e.g. margin=dict(t=100, b=0, l=80, r=0) and pad the overall figure size with these numbers, e.g. height = 100 + cut * 30.
It seems like the automargins are not correctly adding their label padding to the overall figure size, so that would be my suggestion for what could be a possible solution here.
Example code:
import plotly.express as px
import numpy as np
import pandas as pd


np.random.seed(20934)
img = np.random.rand(200, 200)
for cut in [10, 50]:
    fig = px.imshow(
        img[:cut, :cut],
        height=cut * 30,
        width=cut * 30,
        x = [''.join(np.random.choice(list('qwertyuioplkjhgfdsazxcvbnm,.;[098765432'), np.random.choice(40))) for x in range(cut)],
        y = [''.join(np.random.choice(list('qwertyuioplkjhgfdsazxcvbnm,.;[098765432'), np.random.choice(40))) for x in range(cut)],

    )
    fig.update_layout(
        coloraxis_showscale=False,
        margin=dict(t=0, b=0, l=0, r=0),
        xaxis_nticks=cut + 1,
        yaxis_nticks=cut + 1,
    ).update_xaxes(
        automargin=False,
    ).update_yaxes(
        automargin=False,
    )
    fig.show()
Guida per i contributori
Apri la guida per i contributori
Come iniziare
- Leggi tutta la issue e poi la guida ai contributi del progetto.
- Commenta sulla issue per dire che te ne occupi tu — evita che due persone facciano lo stesso lavoro.
- Fai un fork del repository e lavora su un branch.
- Apri una pull request che faccia riferimento al numero della issue.
Direzione di ricerca
Inizia con la riproduzione fornita in Python px.imshow, confrontando automargin=True con la soluzione alternativa basata sui margini manuali e verificando il comportamento di automargin degli assi x e y. Traccia il calcolo o l’applicazione di automargin utilizzati da update_xaxes e update_yaxes. Il lavoro è completato quando le mappe di calore di dimensioni diverse mantengono dimensioni dei pixel, posizionamento e spaziatura delle etichette coerenti senza margini manuali.
Scritto dal modello di indicizzazione a partire dal testo della issue.
Valutazione
- Stack tecnologico
- python
- Ambito
- data-visualization
- Tipo di issue
- Bug
- Difficoltà
- 4/5
- Tempo stimato
- 3-5 giorni
- Stato di attività
- Ferma
- Chiarezza
- Abbastanza chiara
- Idoneità per principianti
- 35/100