Automargins cause imshow figure to jump around and change pixel size and labels spacing
Nadie ha tomado este issue todavía.
- Lenguaje dominante
- Python
- Estrellas
- 18.8k
- Forks
- 2.8k
- Merge medio
- 16 h 26 min
- PR fusionados (30 d)
- 21
Descripción
I wasn't sure if this was a bug initially so I provided a reproducible example and closer description in the forum.
Briefly, with automargin=False, heatmaps of different figure sizes have the same pixel size:

Setting automargin=True creates figures with widely different pixel sizes and shifts where the figure appear and its whitespace (with more than just the label length):
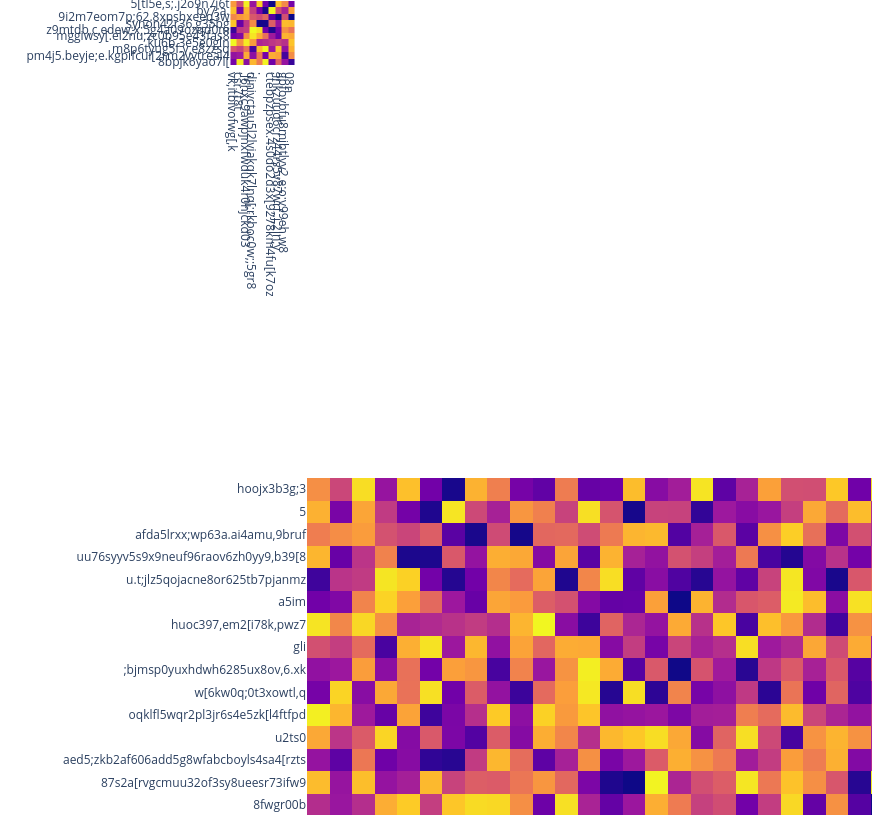
The jumping around behavior and inconsistent pixel sizes both seem to come from a bug in how the automargins are calculated or applied. A workaround is to set automargin=False and then manually specifying how much space is needed for the labels in the margin dictionary, e.g. margin=dict(t=100, b=0, l=80, r=0) and pad the overall figure size with these numbers, e.g. height = 100 + cut * 30.
It seems like the automargins are not correctly adding their label padding to the overall figure size, so that would be my suggestion for what could be a possible solution here.
Example code:
import plotly.express as px
import numpy as np
import pandas as pd


np.random.seed(20934)
img = np.random.rand(200, 200)
for cut in [10, 50]:
    fig = px.imshow(
        img[:cut, :cut],
        height=cut * 30,
        width=cut * 30,
        x = [''.join(np.random.choice(list('qwertyuioplkjhgfdsazxcvbnm,.;[098765432'), np.random.choice(40))) for x in range(cut)],
        y = [''.join(np.random.choice(list('qwertyuioplkjhgfdsazxcvbnm,.;[098765432'), np.random.choice(40))) for x in range(cut)],

    )
    fig.update_layout(
        coloraxis_showscale=False,
        margin=dict(t=0, b=0, l=0, r=0),
        xaxis_nticks=cut + 1,
        yaxis_nticks=cut + 1,
    ).update_xaxes(
        automargin=False,
    ).update_yaxes(
        automargin=False,
    )
    fig.show()
Guía de contribución
Primeros pasos
- Lee el issue completo y luego la guía de contribución del proyecto.
- Comenta en el issue que vas a ocuparte — evita que dos personas hagan lo mismo.
- Haz un fork del repositorio y trabaja en una rama.
- Abre un pull request que haga referencia al número del issue.
Línea de trabajo
Comienza con la reproducción proporcionada de Python px.imshow, comparando automargin=True con la solución alternativa de margen manual y comprobando el comportamiento de automargin en los ejes x e y. Rastrea el cálculo o la aplicación de automargin utilizados por update_xaxes y update_yaxes. Se considera terminado cuando los mapas de calor de distintos tamaños mantienen un tamaño de píxel, posicionamiento y espaciado de etiquetas coherentes sin márgenes manuales.
Escrito por el modelo de indexación a partir del texto del issue.
Evaluación
- Stack tecnológico
- python
- Área
- data-visualization
- Tipo de issue
- Error
- Dificultad
- 4/5
- Tiempo estimado
- 3-5 días
- Estado de actividad
- Estancado
- Claridad
- Bastante claro
- Aptitud para principiantes
- 35/100