Automargins cause imshow figure to jump around and change pixel size and labels spacing
Dieses Issue hat noch niemand übernommen.
- Vorherrschende Sprache
- Python
- Sterne
- 18.8k
- Forks
- 2.8k
- Ø Merge
- 16 Std. 26 Min.
- Gemergte PRs (30 T.)
- 21
Beschreibung
I wasn't sure if this was a bug initially so I provided a reproducible example and closer description in the forum.
Briefly, with automargin=False, heatmaps of different figure sizes have the same pixel size:

Setting automargin=True creates figures with widely different pixel sizes and shifts where the figure appear and its whitespace (with more than just the label length):
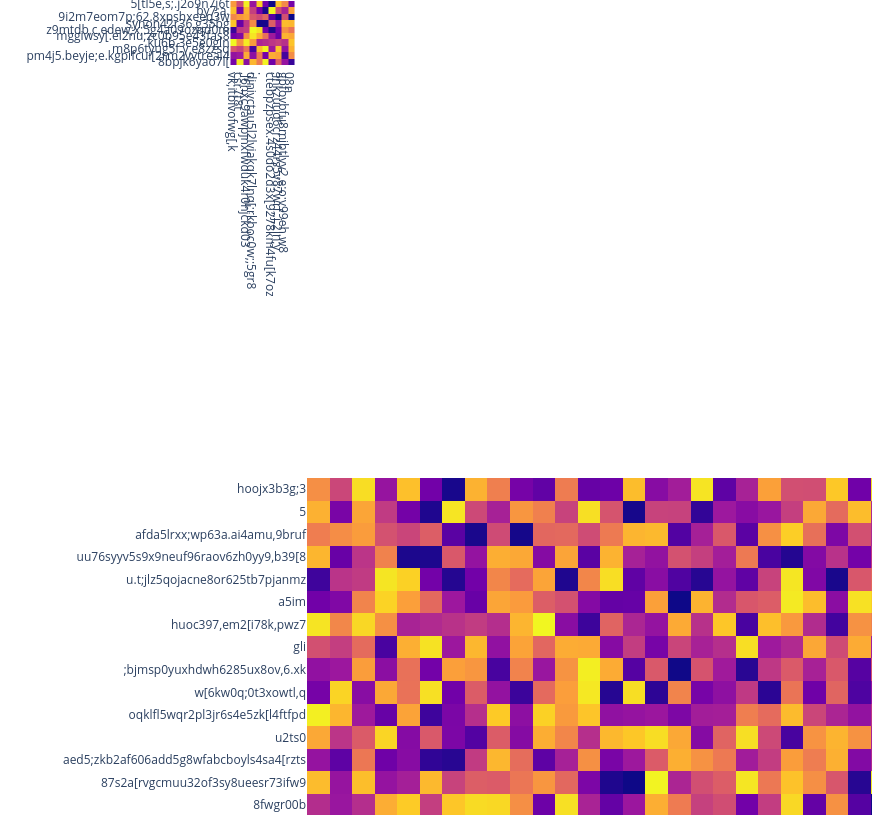
The jumping around behavior and inconsistent pixel sizes both seem to come from a bug in how the automargins are calculated or applied. A workaround is to set automargin=False and then manually specifying how much space is needed for the labels in the margin dictionary, e.g. margin=dict(t=100, b=0, l=80, r=0) and pad the overall figure size with these numbers, e.g. height = 100 + cut * 30.
It seems like the automargins are not correctly adding their label padding to the overall figure size, so that would be my suggestion for what could be a possible solution here.
Example code:
import plotly.express as px
import numpy as np
import pandas as pd


np.random.seed(20934)
img = np.random.rand(200, 200)
for cut in [10, 50]:
    fig = px.imshow(
        img[:cut, :cut],
        height=cut * 30,
        width=cut * 30,
        x = [''.join(np.random.choice(list('qwertyuioplkjhgfdsazxcvbnm,.;[098765432'), np.random.choice(40))) for x in range(cut)],
        y = [''.join(np.random.choice(list('qwertyuioplkjhgfdsazxcvbnm,.;[098765432'), np.random.choice(40))) for x in range(cut)],

    )
    fig.update_layout(
        coloraxis_showscale=False,
        margin=dict(t=0, b=0, l=0, r=0),
        xaxis_nticks=cut + 1,
        yaxis_nticks=cut + 1,
    ).update_xaxes(
        automargin=False,
    ).update_yaxes(
        automargin=False,
    )
    fig.show()
Beitragsleitfaden
Erste Schritte
- Lies das ganze Issue und danach den Beitragsleitfaden des Projekts.
- Schreib ins Issue, dass du es übernimmst — das erspart doppelte Arbeit.
- Forke das Repository und arbeite in einem Branch.
- Öffne einen Pull Request, der die Issue-Nummer nennt.
Rechercherichtung
Beginnen Sie mit der bereitgestellten Python px.imshow-Reproduktion, vergleichen Sie automargin=True mit dem manuellen Rand-Workaround und überprüfen Sie das automargin-Verhalten der x- und y-Achsen. Verfolgen Sie die für update_xaxes und update_yaxes verwendete Berechnung oder Anwendung von automargin. Als erledigt gilt die Aufgabe, wenn Heatmaps unterschiedlicher Größe ohne manuelle Ränder eine konsistente Pixelgröße, Positionierung und Beschriftungsabstände beibehalten.
Vom Indexierungsmodell aus dem Issue-Text verfasst.
Bewertung
- Tech-Stack
- python
- Bereich
- data-visualization
- Issue-Typ
- Bug
- Schwierigkeit
- 4/5
- Geschätzter Aufwand
- 3-5 Tage
- Aktivitätsstatus
- Veraltet
- Klarheit
- Größtenteils klar
- Anfängerfreundlichkeit
- 35/100