Scattermapbox fill plotting jagged lines
Chưa có ai nhận issue này.
- Ngôn ngữ chính
- Python
- Star
- 18.8k
- Fork
- 2.8k
- Merge trung bình
- 16 giờ 26 phút
- Pull request đã merge (30 ngày)
- 21
Mô tả
Issue
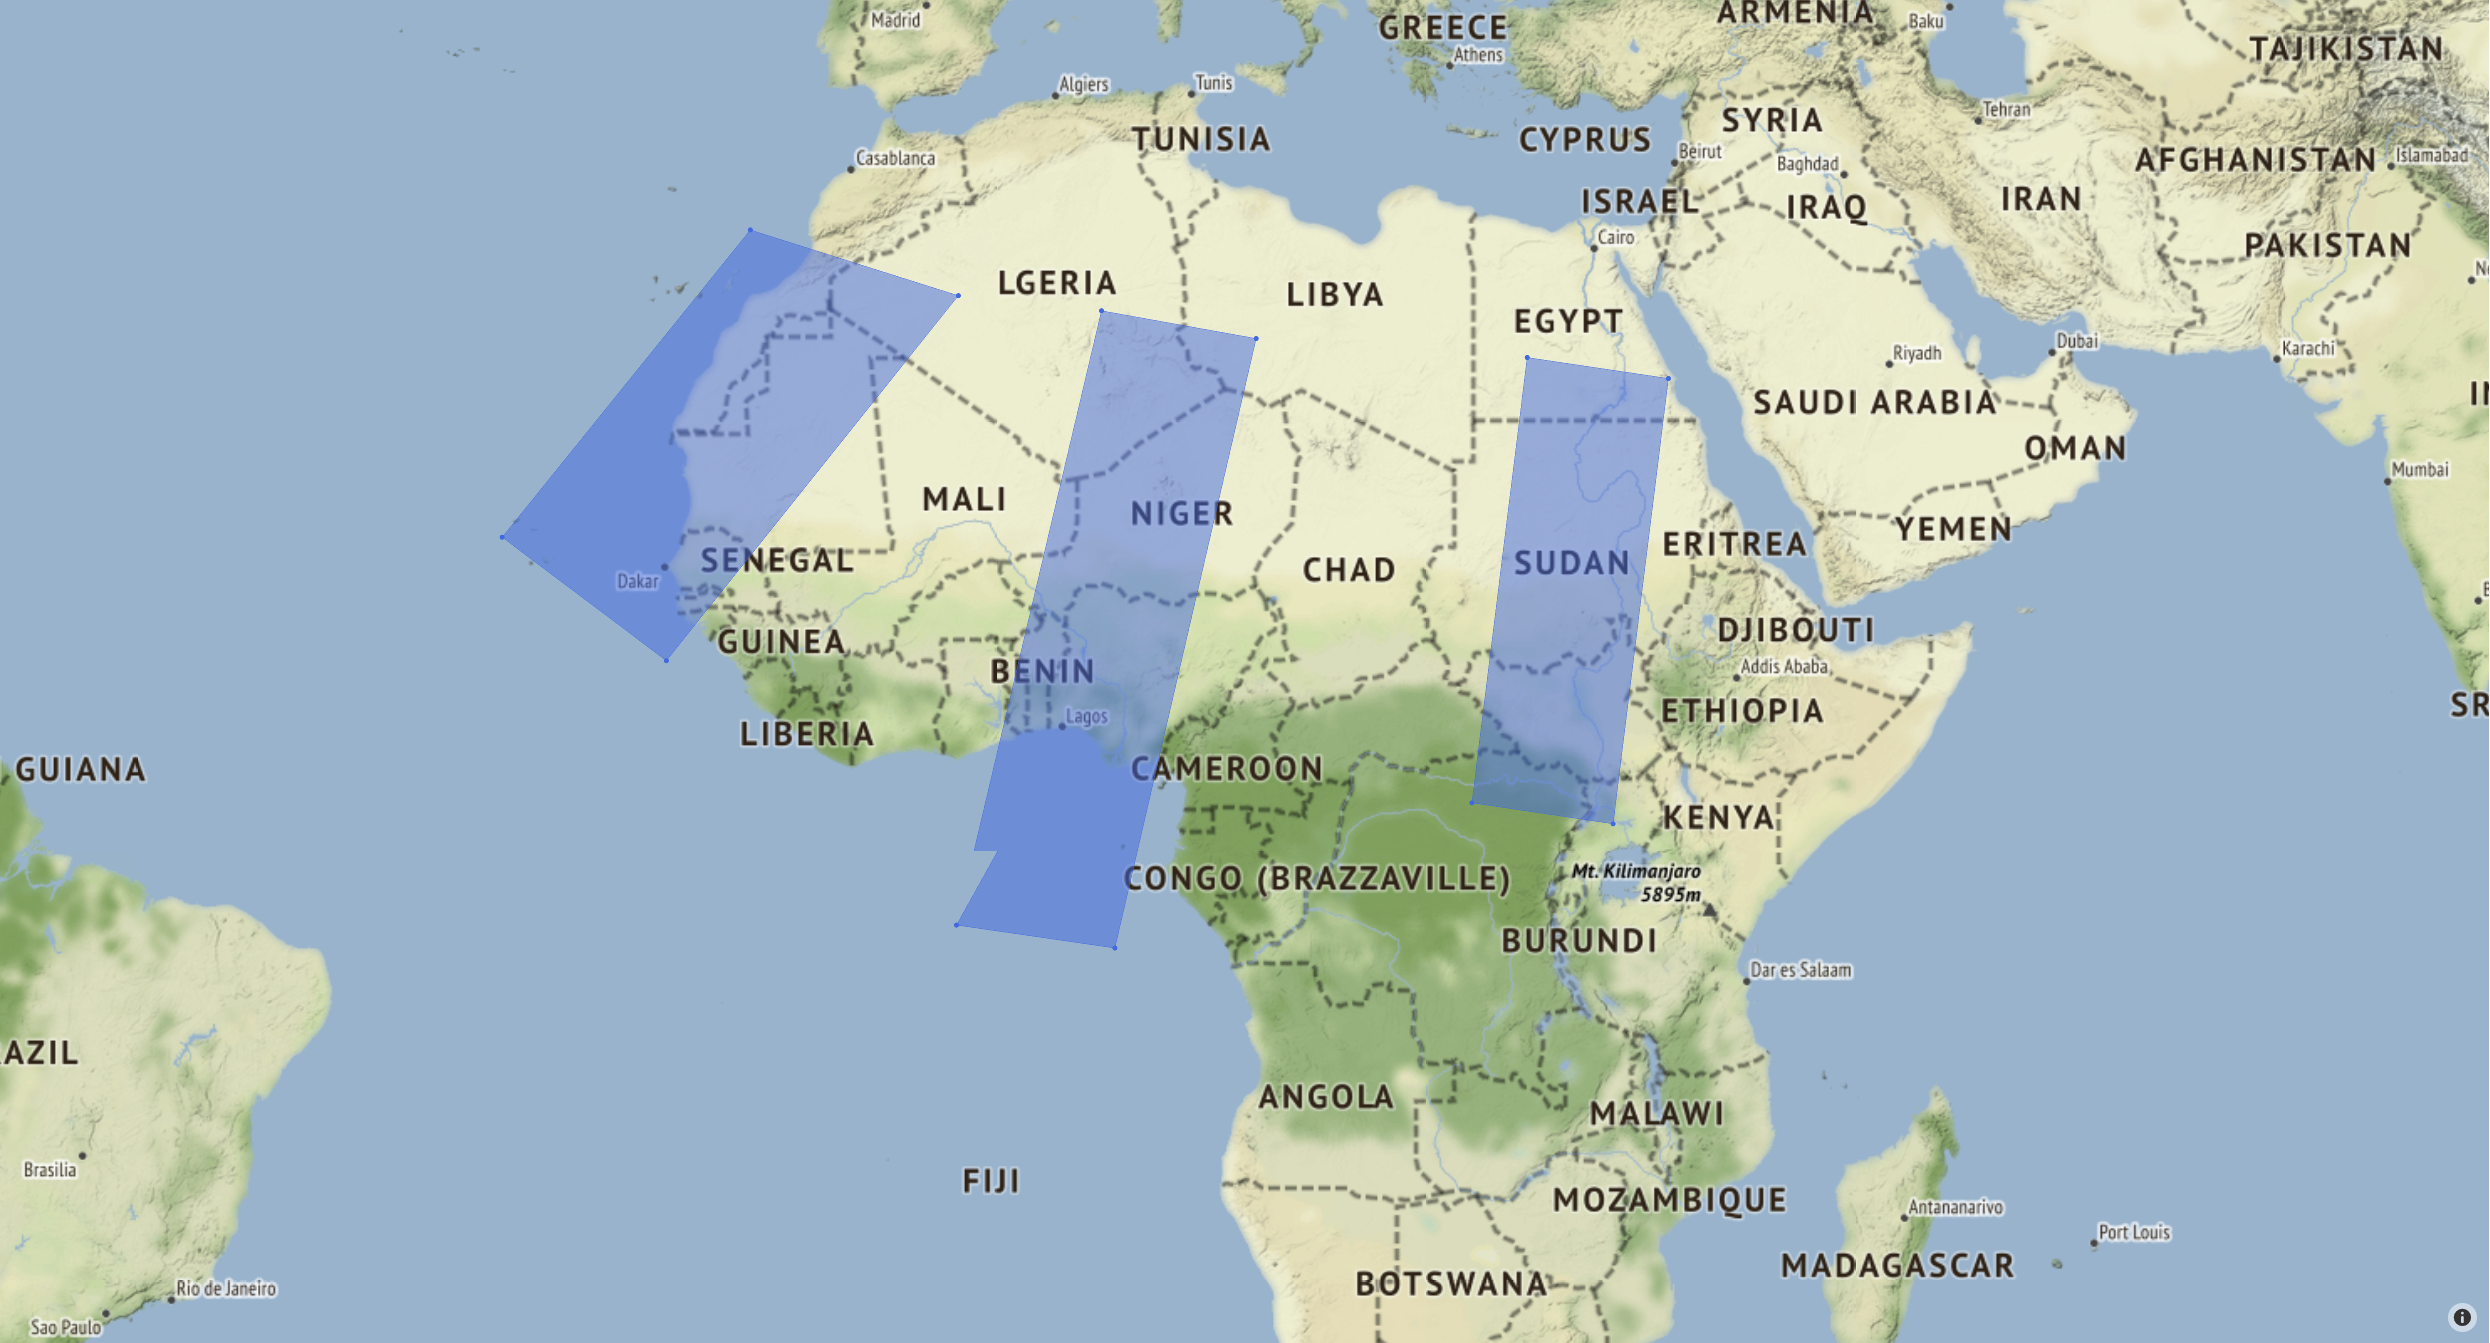
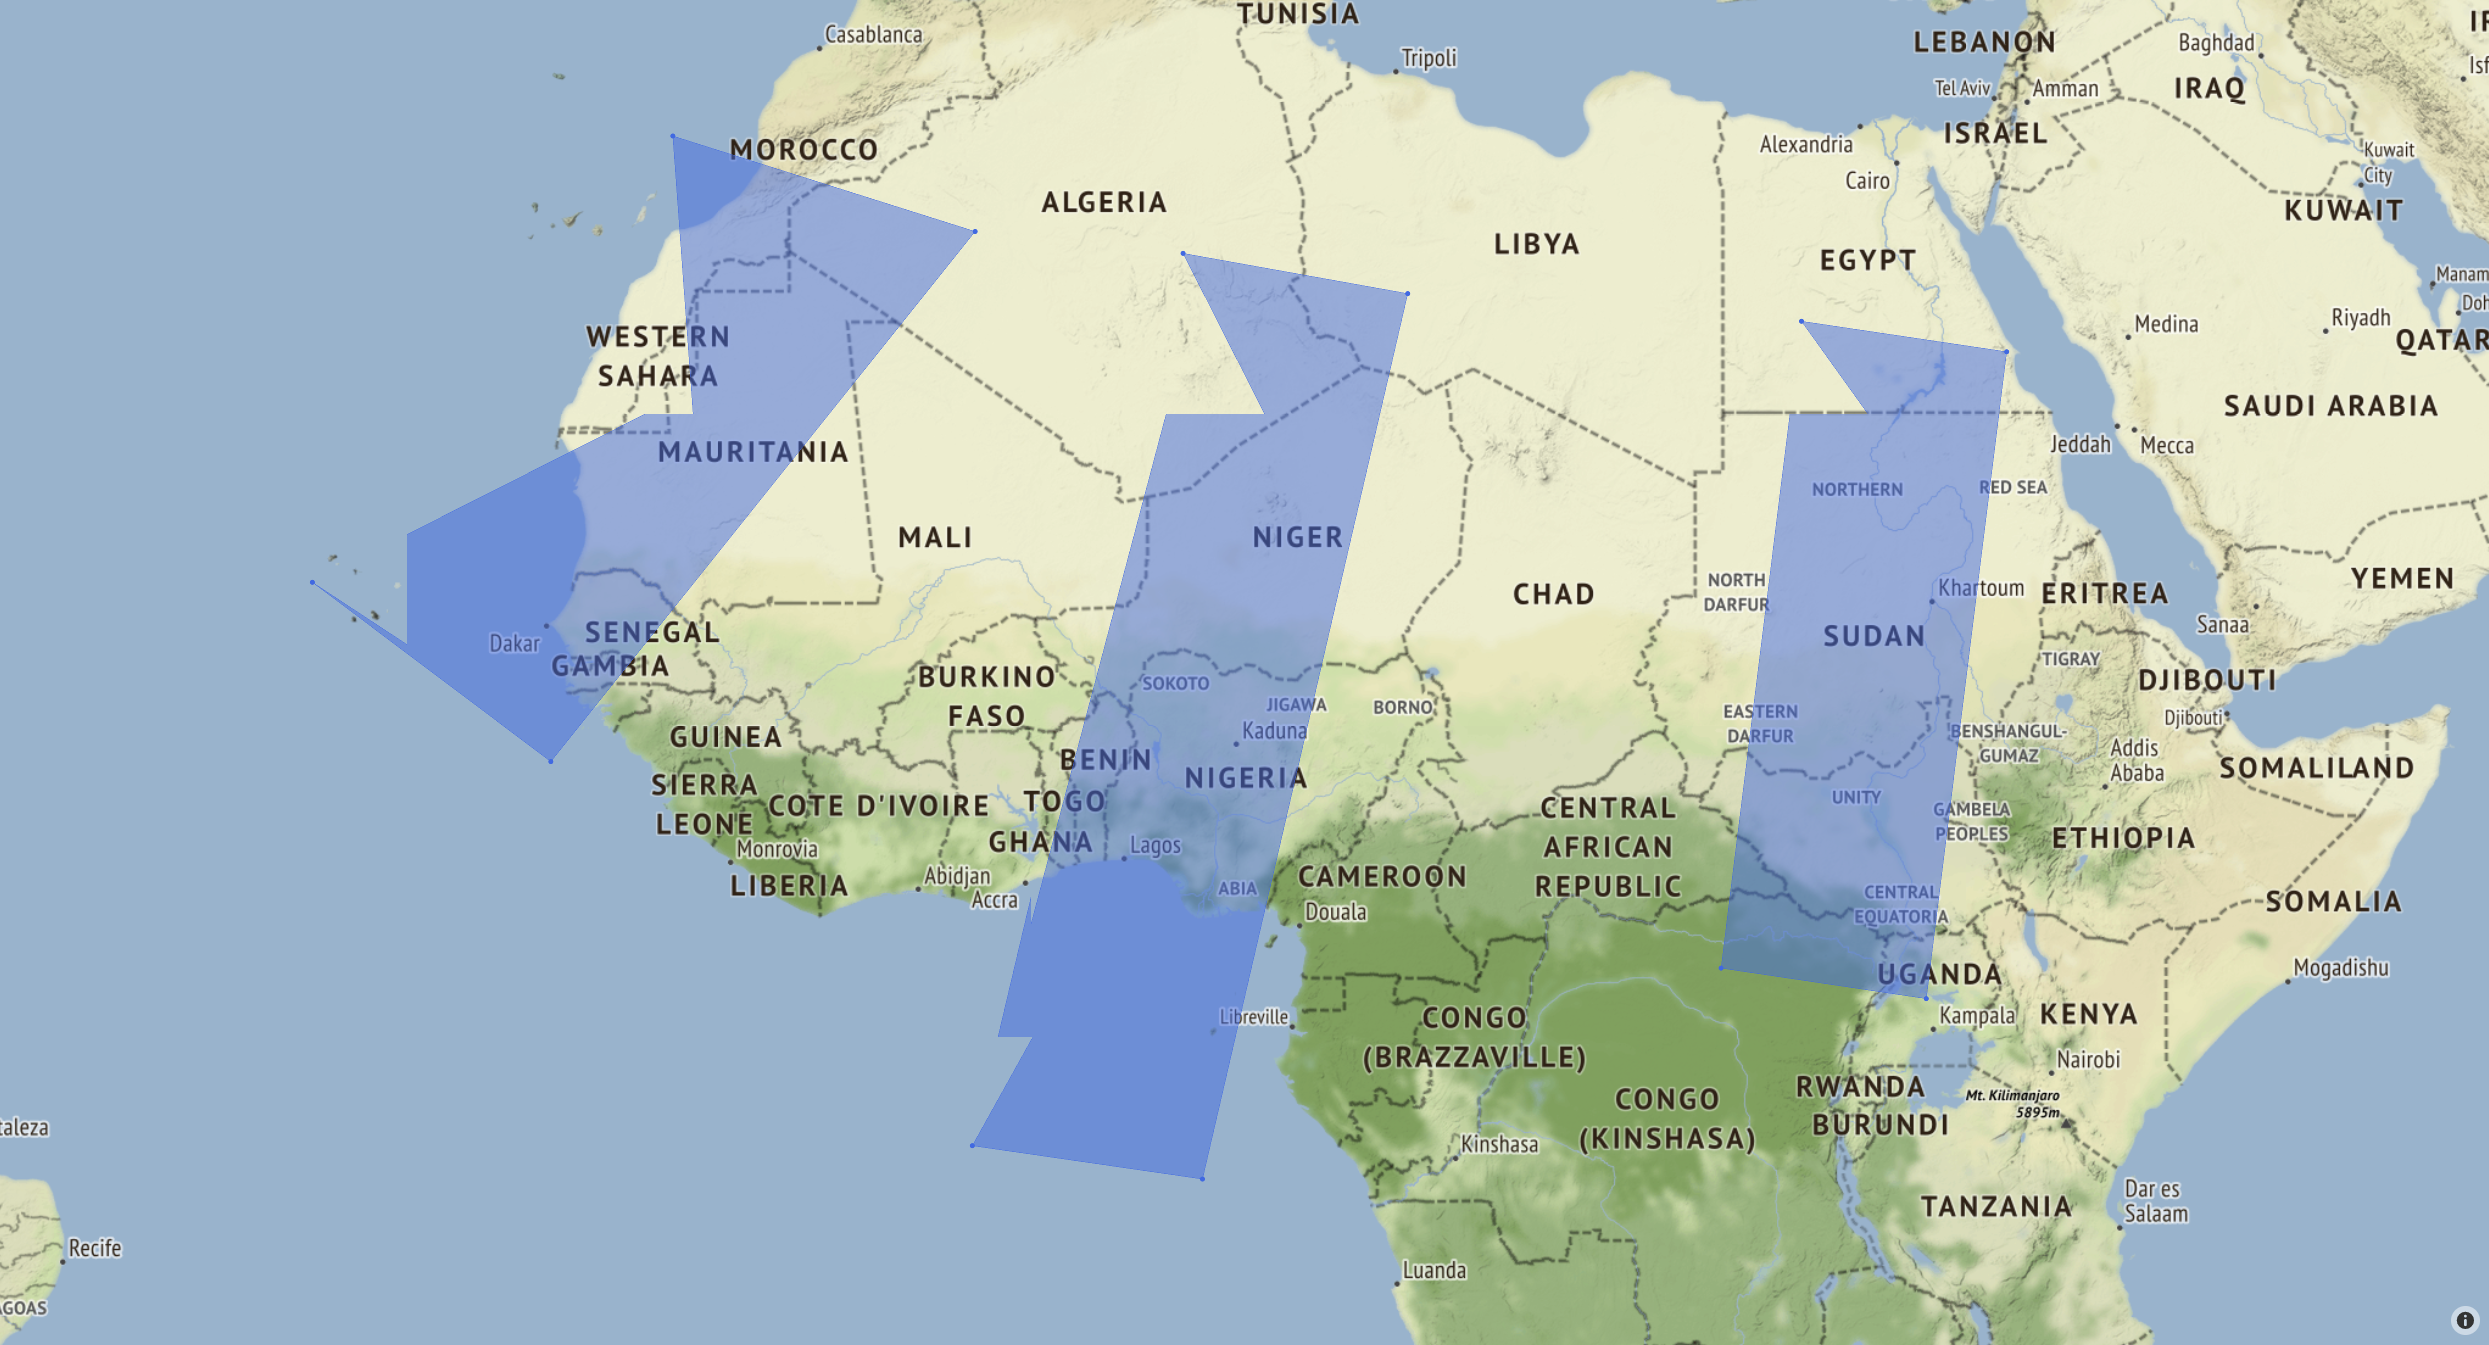
I'm plotting filled polygons on a map using Scattermapbox. It successfully plots the corner markers, but doesn't show a straight line between the two points, seen in the first image. When zooming in on the map, it makes even more jagged lines on all the polygons, seen in the second image.
I tried running the code and opening the .html file on both a windows and linux machine, with the same results.
Specifications
- Windows 10
- Chrome 92.0.4515.131
- python 3.8.11
- plotly 5.1.0
Issue also appears with:
- Ubuntu 18.0.45
- Firefox 91.0 / Edge 91.0.864.64
- python 3.6.9
- plotly 4.14.3
Code to produce the images
import numpy as np
import plotly.graph_objects as go

corners1 = np.array([[5.5, 13.6, 6.2, -2.1], [27.2, 25.9, -5.1, -3.9]])
corners2 = np.array([[-12.9, -2.0, -17.3, -25.9], [30.9, 27.9, 9.9, 16.2]])
corners3 = np.array([[27.8, 35.2, 32.3, 24.9], [25.0, 24.0, 1.4, 2.5]])

sat_corners = [corners1, corners2, corners3]

fig = go.Figure()
for corners in sat_corners:
    fig.add_trace(go.Scattermapbox(
        fill="toself",
        lat=corners[:][1],
        lon=corners[:][0],
        marker={'size': 5, 'color': 'royalblue'}))

fig.update_layout(
    mapbox={
        'style': "stamen-terrain",
        'center': {'lat': 11.547231, 'lon': -5.885243},
        'zoom': 3.5},
    showlegend=False,
    margin_t=20, margin_r=20, margin_b=20, margin_l=20
)

fig.show()
fig.write_html('test_map.html')
fig.write_image('test_map.png', width=1000, height=1000, engine='kaleido')
Resulting Images
These images are screengrabs from Chrome:
Dog leg is visible in the lower left corner of the center polygon.
Here, jagged lines are visible on all polygons. Lines stay like this as far as you can zoom in.
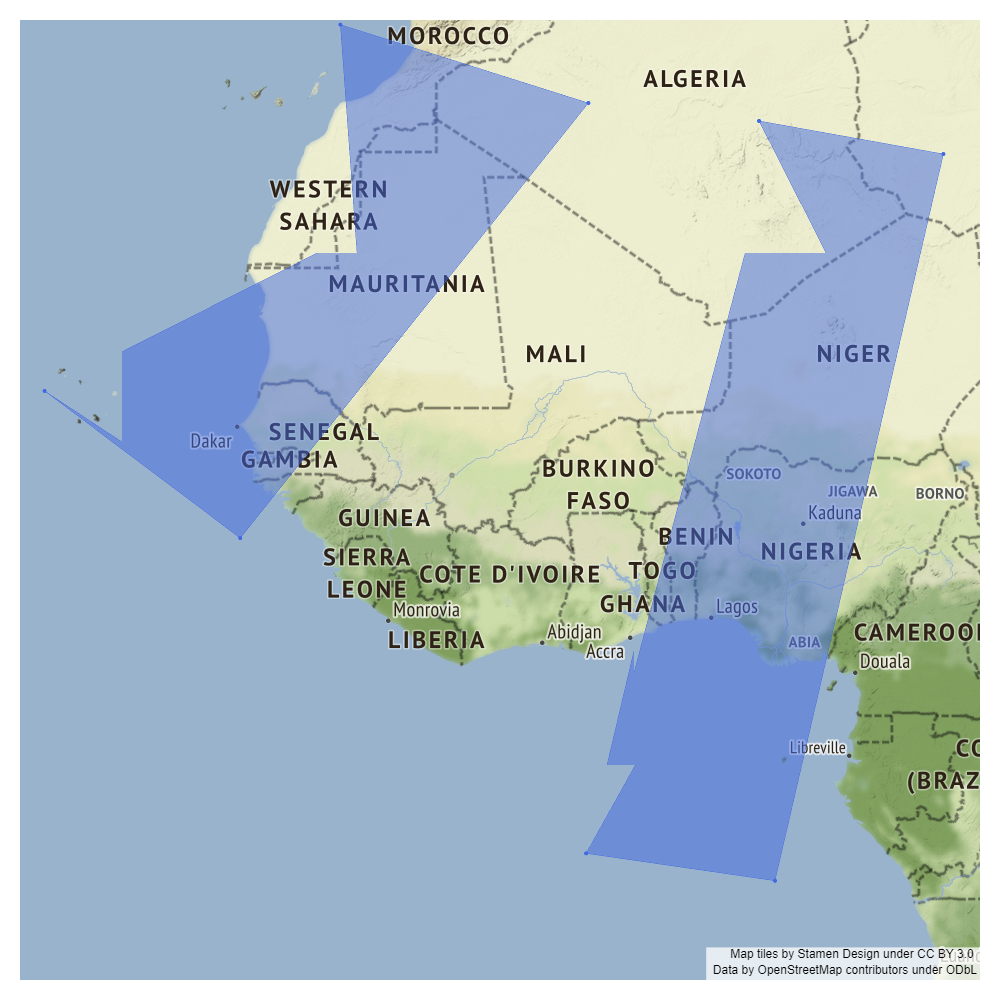
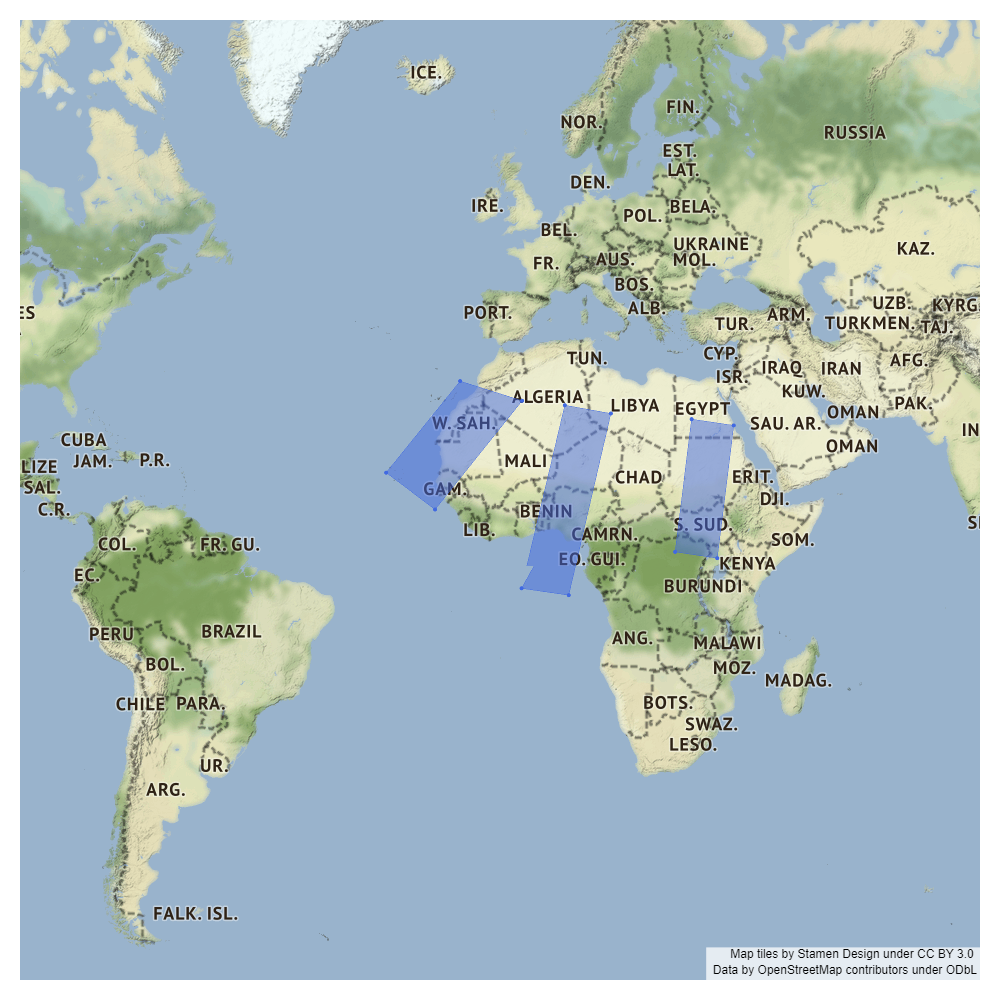
These images are the .png files with different zoom parameters given in fig.update_layout:
zoom=4:
zoom=3:

zoom=2:
Hướng dẫn đóng góp
Bắt đầu từ đâu
- Đọc hết issue, rồi đọc hướng dẫn đóng góp của dự án.
- Bình luận trên issue rằng bạn sẽ nhận — tránh hai người làm cùng một việc.
- Fork repository và làm thay đổi trên một nhánh.
- Mở pull request có tham chiếu số hiệu của issue.
Hướng nghiên cứu
Bắt đầu bằng cách chạy ví dụ Scattermapbox được cung cấp với các tọa độ đa giác đã liệt kê và so sánh đầu ra HTML tương tác với PNG được tạo ở các mức thu phóng khác nhau. Điều tra đường dẫn kết xuất phần tô của Scattermapbox và xác minh kết quả trên các phiên bản trình duyệt và Plotly đã được báo cáo. Được xem là hoàn tất khi các cạnh đa giác được kết xuất thành các đường thẳng mà không có các hiện tượng răng cưa đã được báo cáo.
Do mô hình lập chỉ mục viết ra từ nội dung của issue.
Đánh giá
- Công nghệ
- plotly, python
- Lĩnh vực
- data-visualization
- Loại issue
- Lỗi
- Độ khó
- 4/5
- Thời gian dự kiến
- 3-5 ngày
- Mức độ hoạt động
- Đình trệ
- Độ rõ ràng
- Khá rõ ràng
- Mức phù hợp với người mới
- 35/100