Scattermapbox fill plotting jagged lines
Nobody has claimed this yet.
- Dominant language
- Python
- Stars
- 18.8k
- Forks
- 2.8k
- Avg merge
- 16h 26m
- Merged PRs (30d)
- 21
Description
Issue
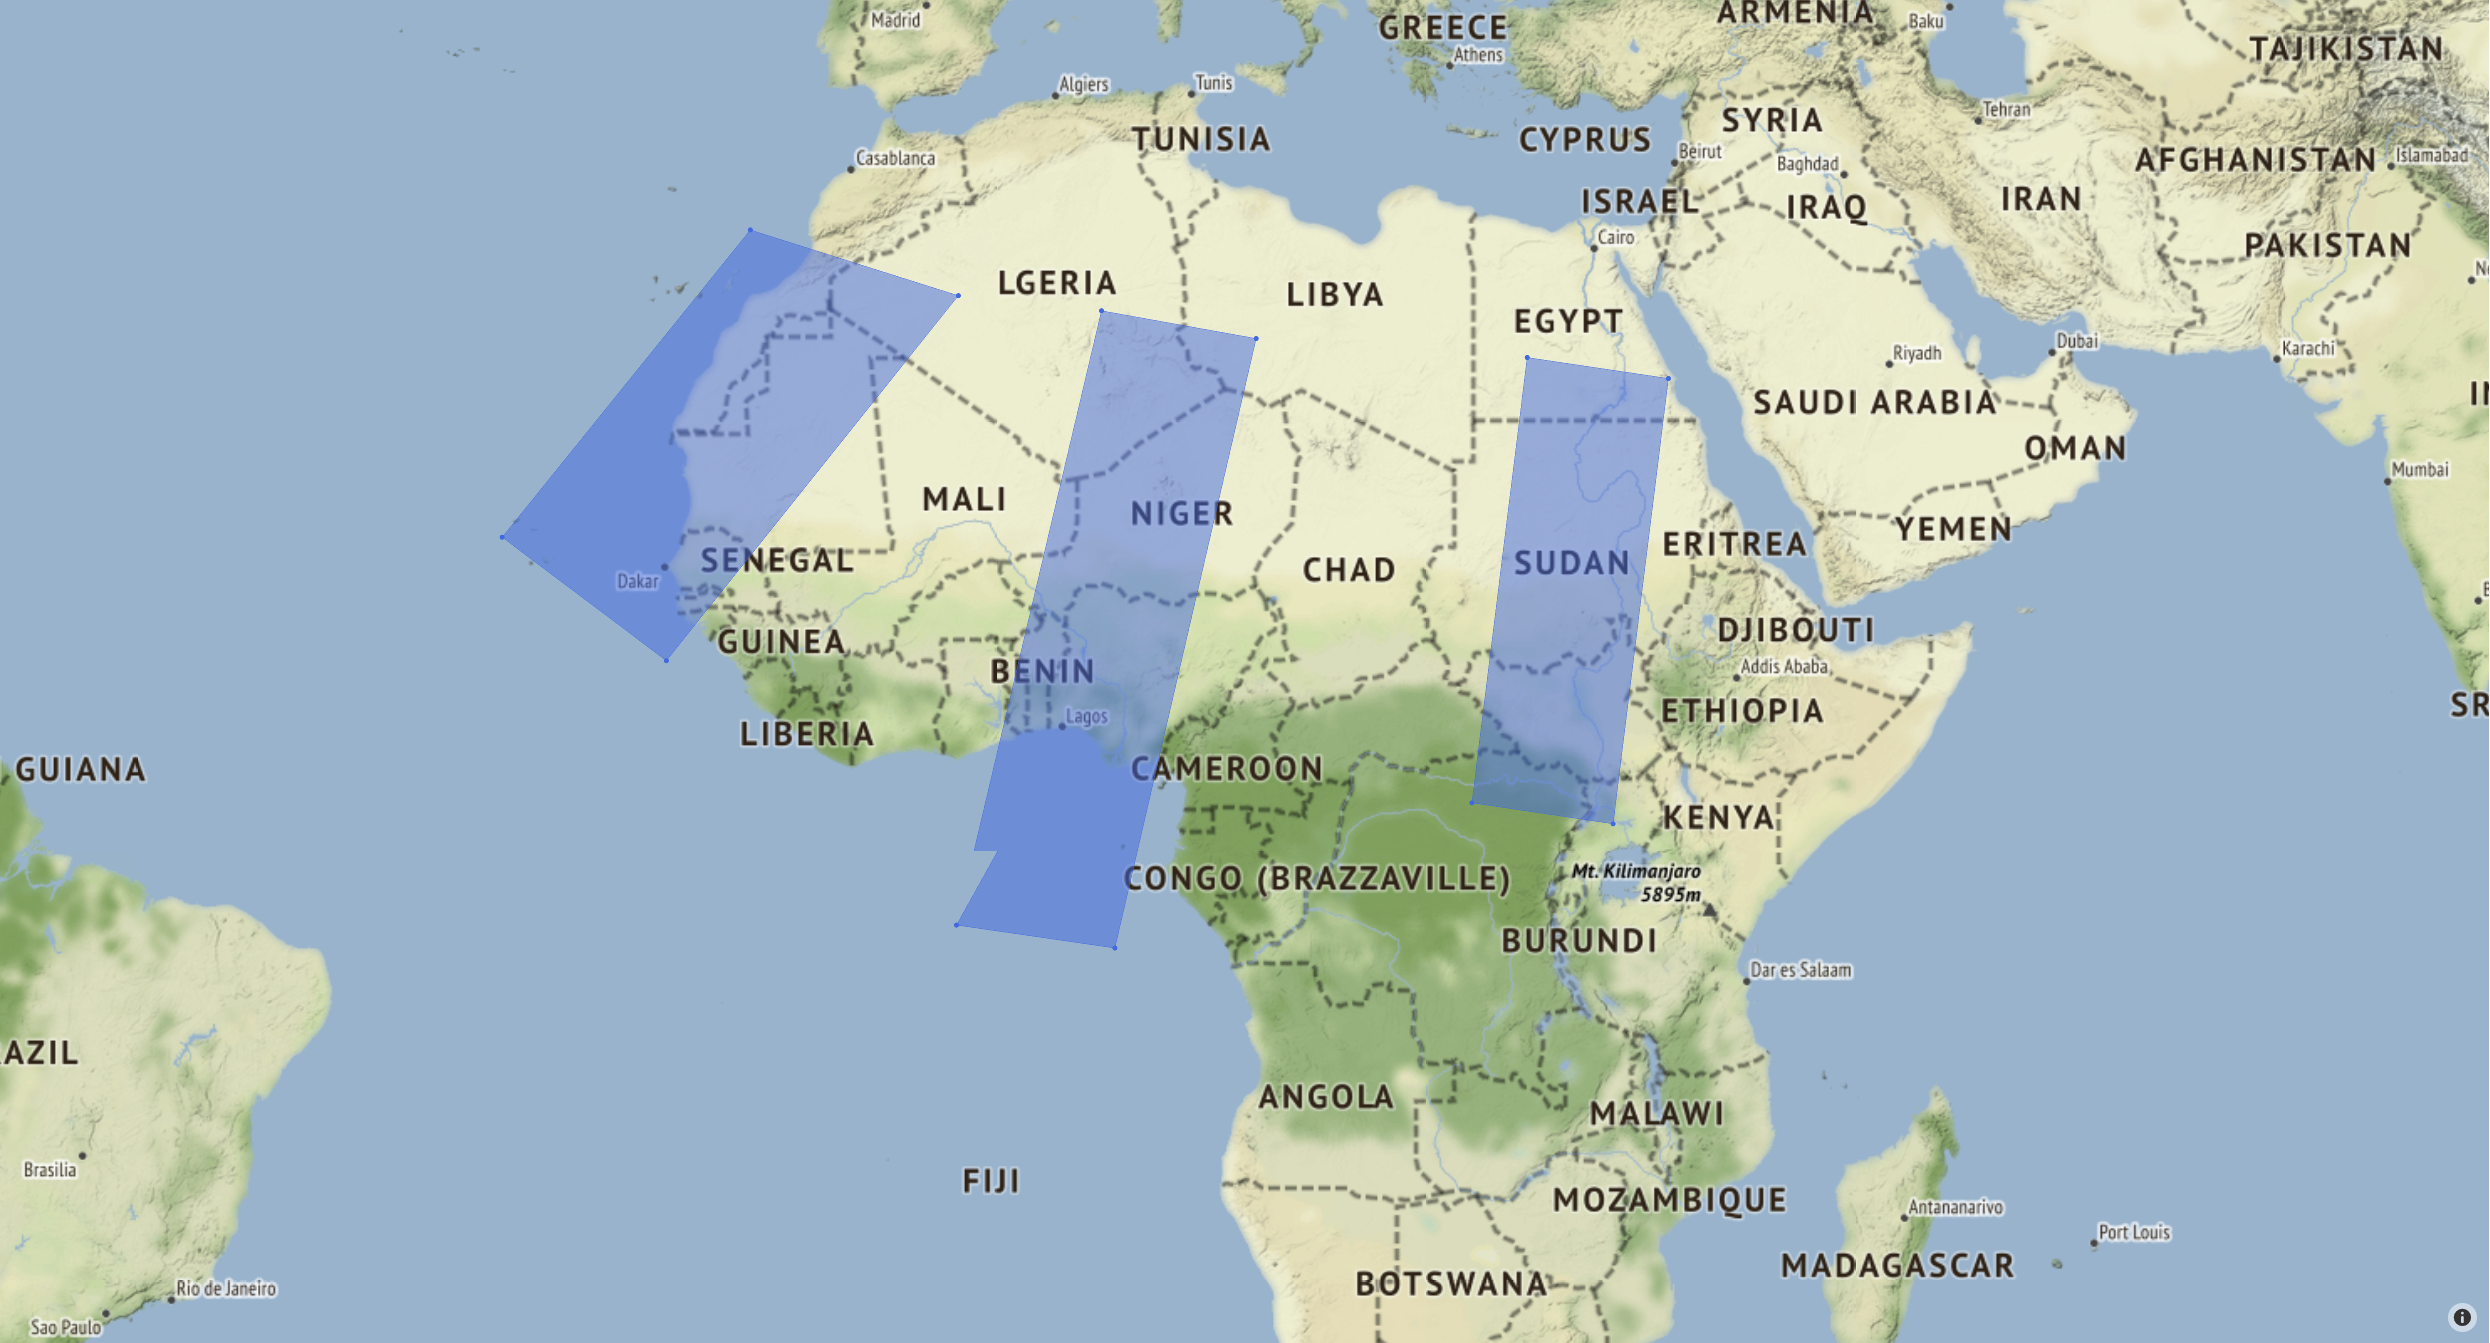
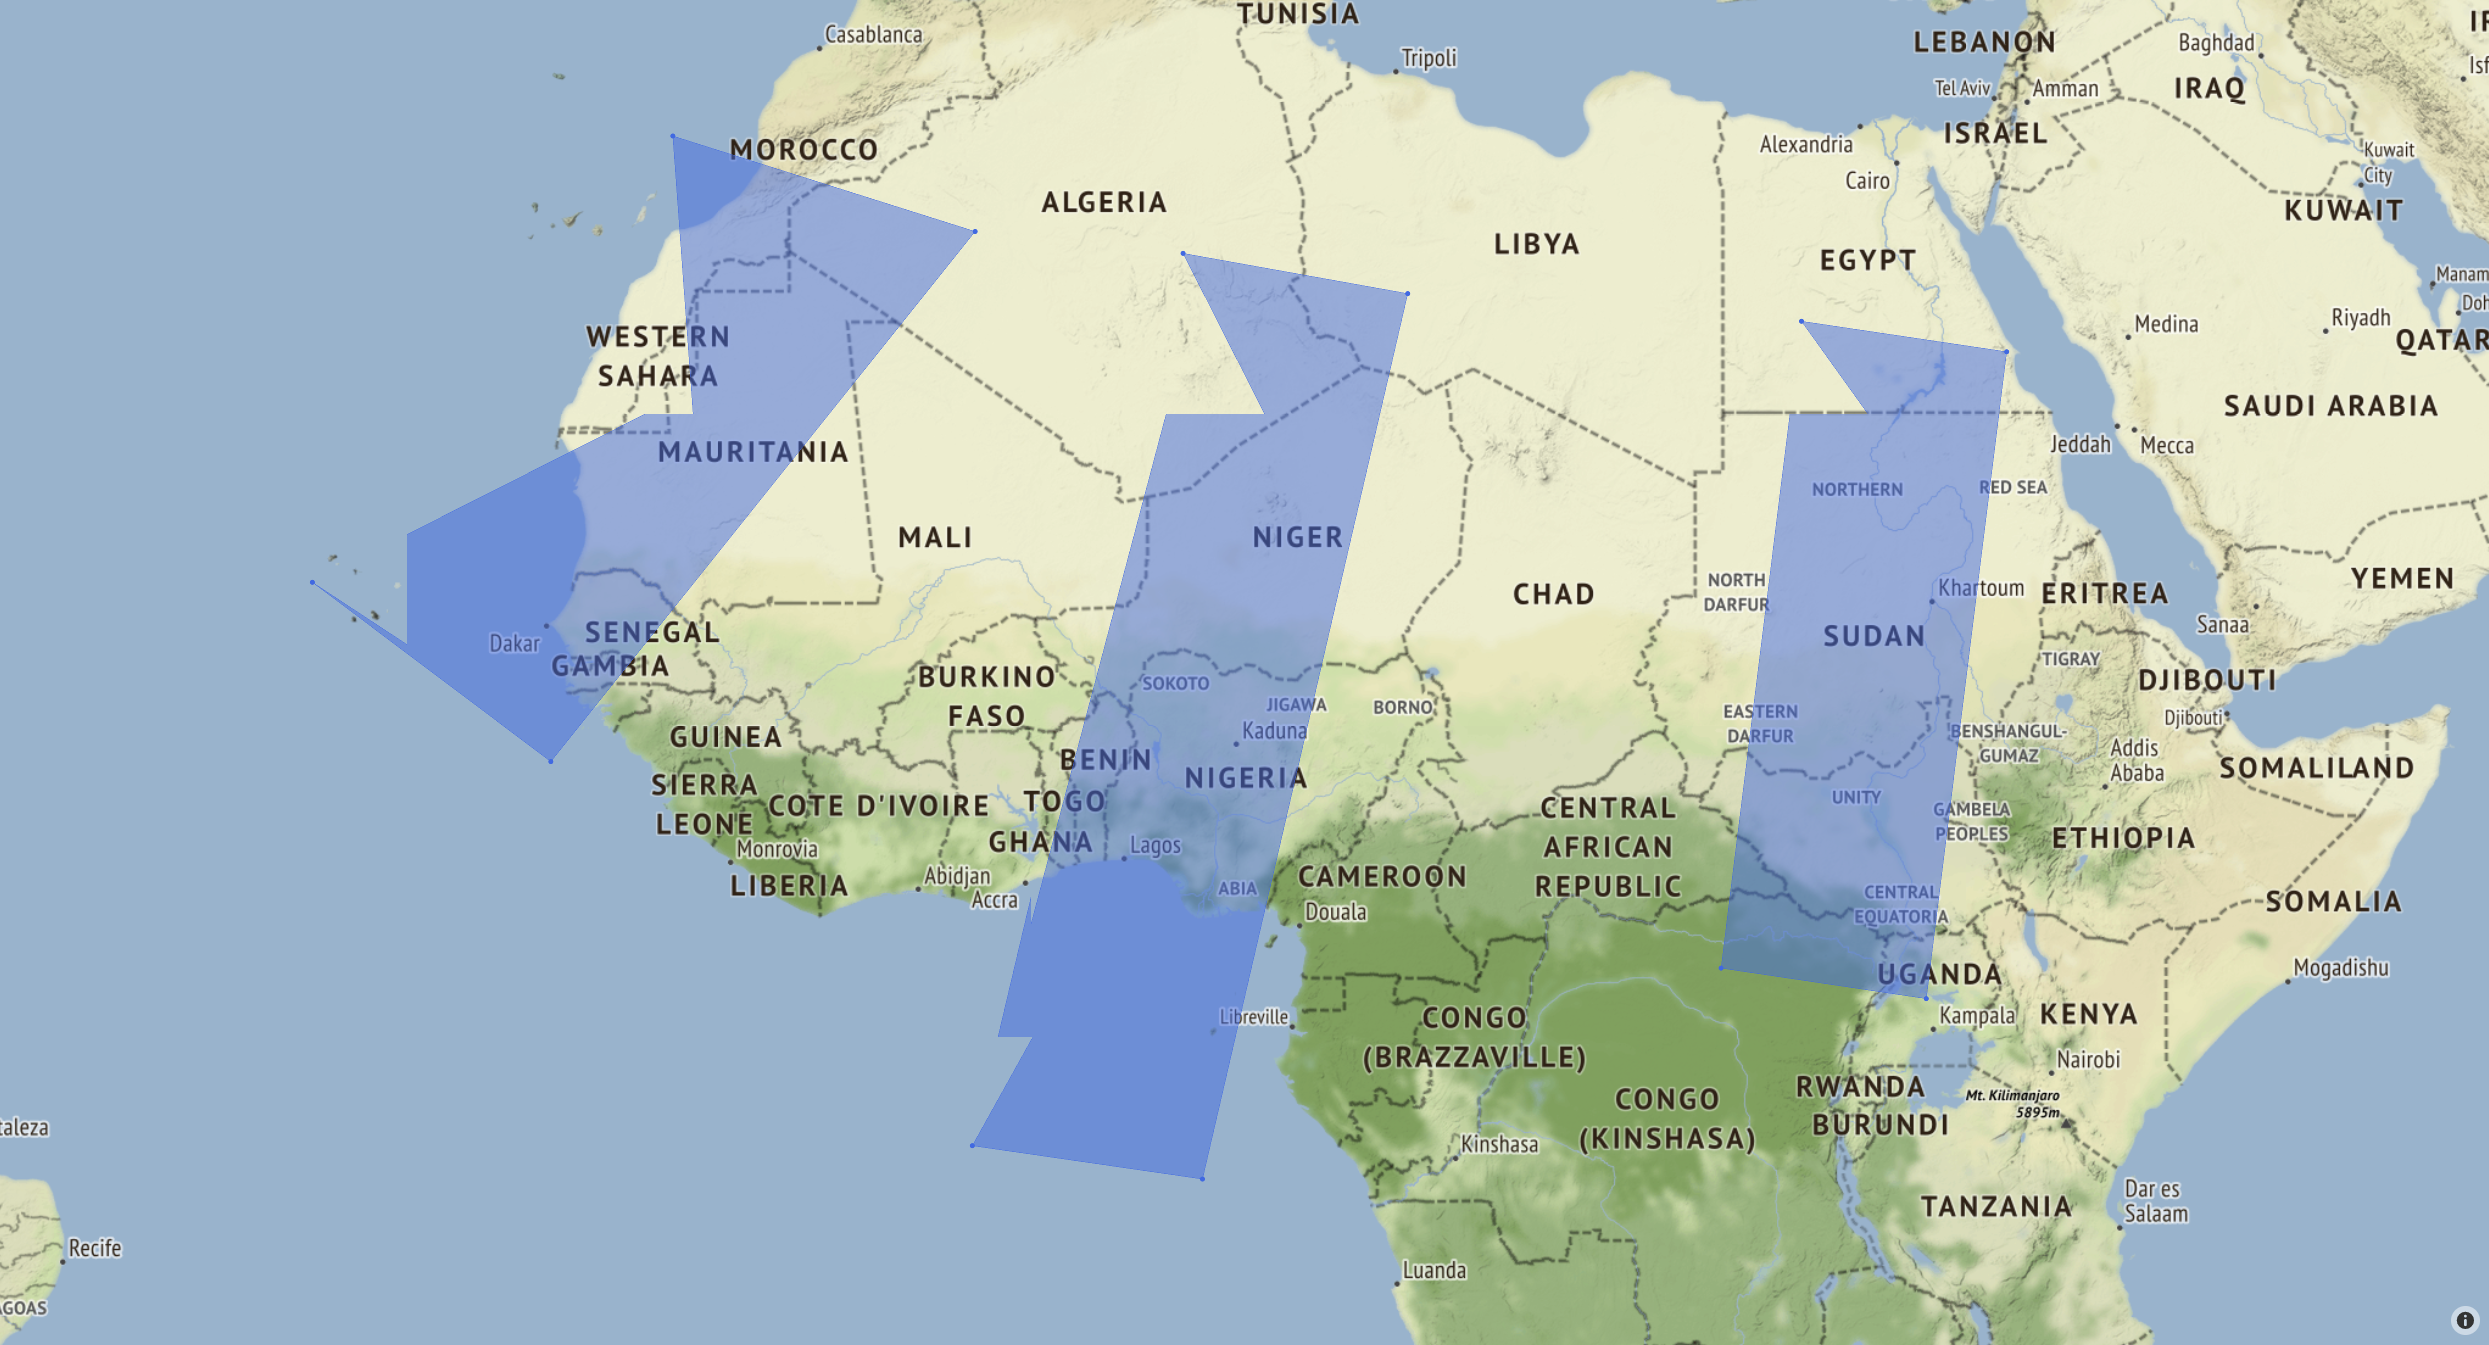
I'm plotting filled polygons on a map using Scattermapbox. It successfully plots the corner markers, but doesn't show a straight line between the two points, seen in the first image. When zooming in on the map, it makes even more jagged lines on all the polygons, seen in the second image.
I tried running the code and opening the .html file on both a windows and linux machine, with the same results.
Specifications
- Windows 10
- Chrome 92.0.4515.131
- python 3.8.11
- plotly 5.1.0
Issue also appears with:
- Ubuntu 18.0.45
- Firefox 91.0 / Edge 91.0.864.64
- python 3.6.9
- plotly 4.14.3
Code to produce the images
import numpy as np
import plotly.graph_objects as go

corners1 = np.array([[5.5, 13.6, 6.2, -2.1], [27.2, 25.9, -5.1, -3.9]])
corners2 = np.array([[-12.9, -2.0, -17.3, -25.9], [30.9, 27.9, 9.9, 16.2]])
corners3 = np.array([[27.8, 35.2, 32.3, 24.9], [25.0, 24.0, 1.4, 2.5]])

sat_corners = [corners1, corners2, corners3]

fig = go.Figure()
for corners in sat_corners:
    fig.add_trace(go.Scattermapbox(
        fill="toself",
        lat=corners[:][1],
        lon=corners[:][0],
        marker={'size': 5, 'color': 'royalblue'}))

fig.update_layout(
    mapbox={
        'style': "stamen-terrain",
        'center': {'lat': 11.547231, 'lon': -5.885243},
        'zoom': 3.5},
    showlegend=False,
    margin_t=20, margin_r=20, margin_b=20, margin_l=20
)

fig.show()
fig.write_html('test_map.html')
fig.write_image('test_map.png', width=1000, height=1000, engine='kaleido')
Resulting Images
These images are screengrabs from Chrome:
Dog leg is visible in the lower left corner of the center polygon.
Here, jagged lines are visible on all polygons. Lines stay like this as far as you can zoom in.
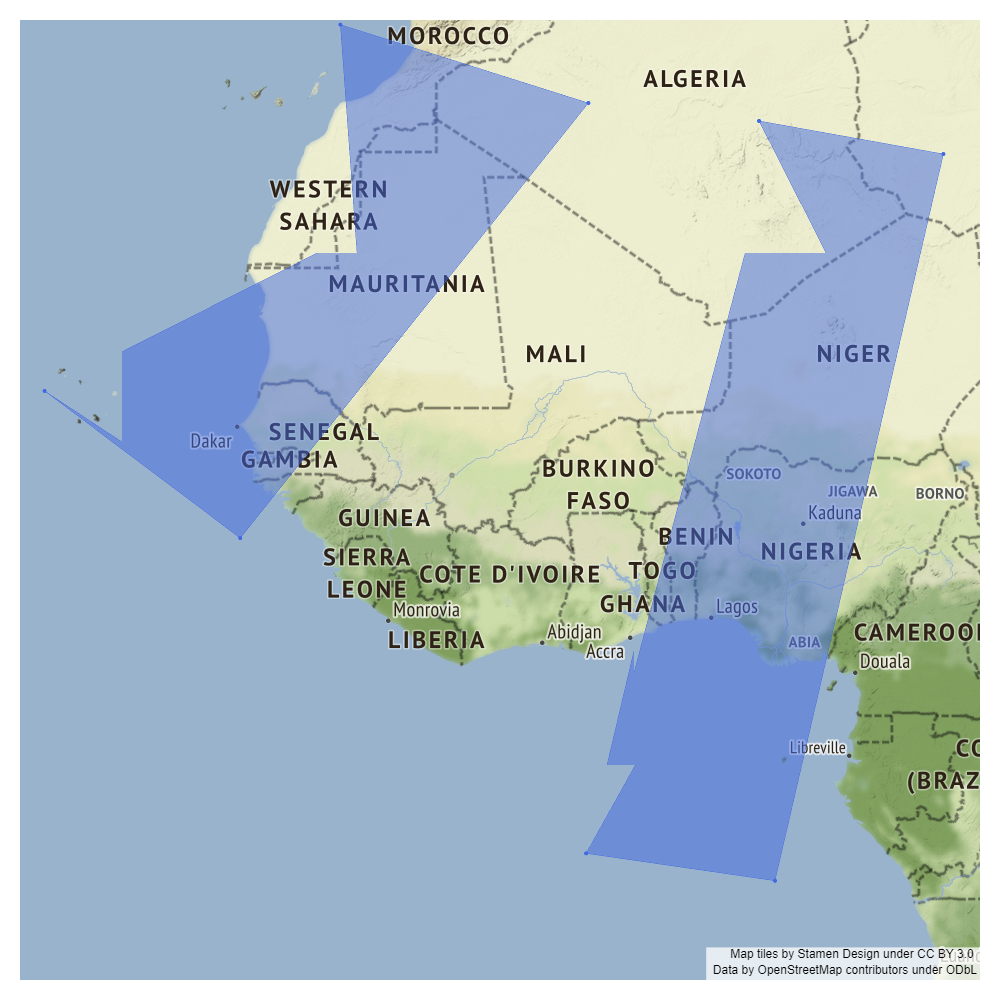
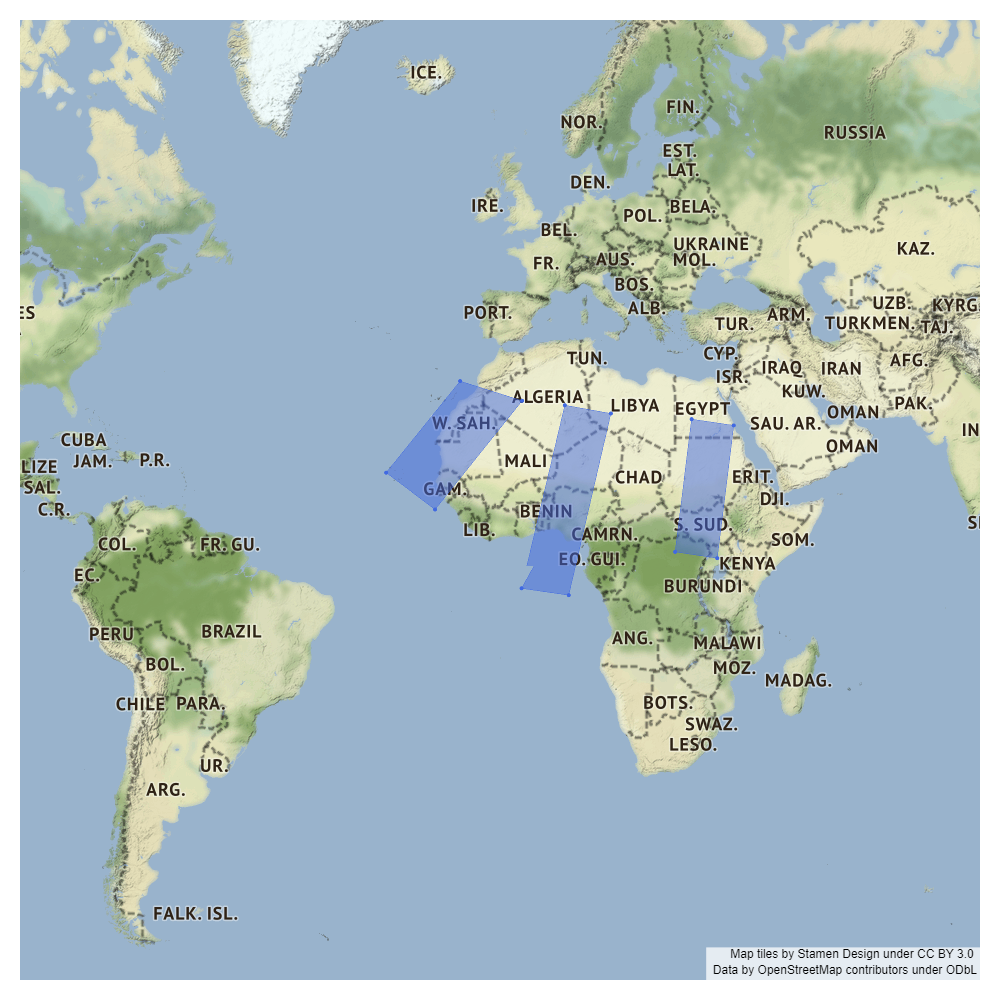
These images are the .png files with different zoom parameters given in fig.update_layout:
zoom=4:
zoom=3:

zoom=2:
Contributor guide
First steps
- Read the whole issue, then the project's contributing guide.
- Comment on the issue to say you are picking it up — it saves two people doing the same work.
- Fork the repository and make your change on a branch.
- Open a pull request that references the issue number.
Research direction
Start by running the supplied Scattermapbox example with the listed polygon coordinates and compare the interactive HTML output with the generated PNG at different zoom levels. Investigate the Scattermapbox fill rendering path and verify the result across the reported browser and Plotly versions. Done means polygon edges render as straight lines without the reported jagged artifacts.
Written by the indexing model from the issue text.
Assessment
- Tech stack
- plotly, python
- Domain
- data-visualization
- Issue type
- Bug
- Difficulty
- 4/5
- Estimated time
- 3-5 days
- Activity status
- Stale
- Clarity
- Mostly clear
- Newbie friendliness
- 35/100