Scattermapbox fill plotting jagged lines
还没有人认领这个 Issue。
- 主要语言
- Python
- 星标
- 18.8k
- 派生
- 2.8k
- 平均合并
- 16 小时 26 分钟
- 30 天内合并 PR
- 21
描述
Issue
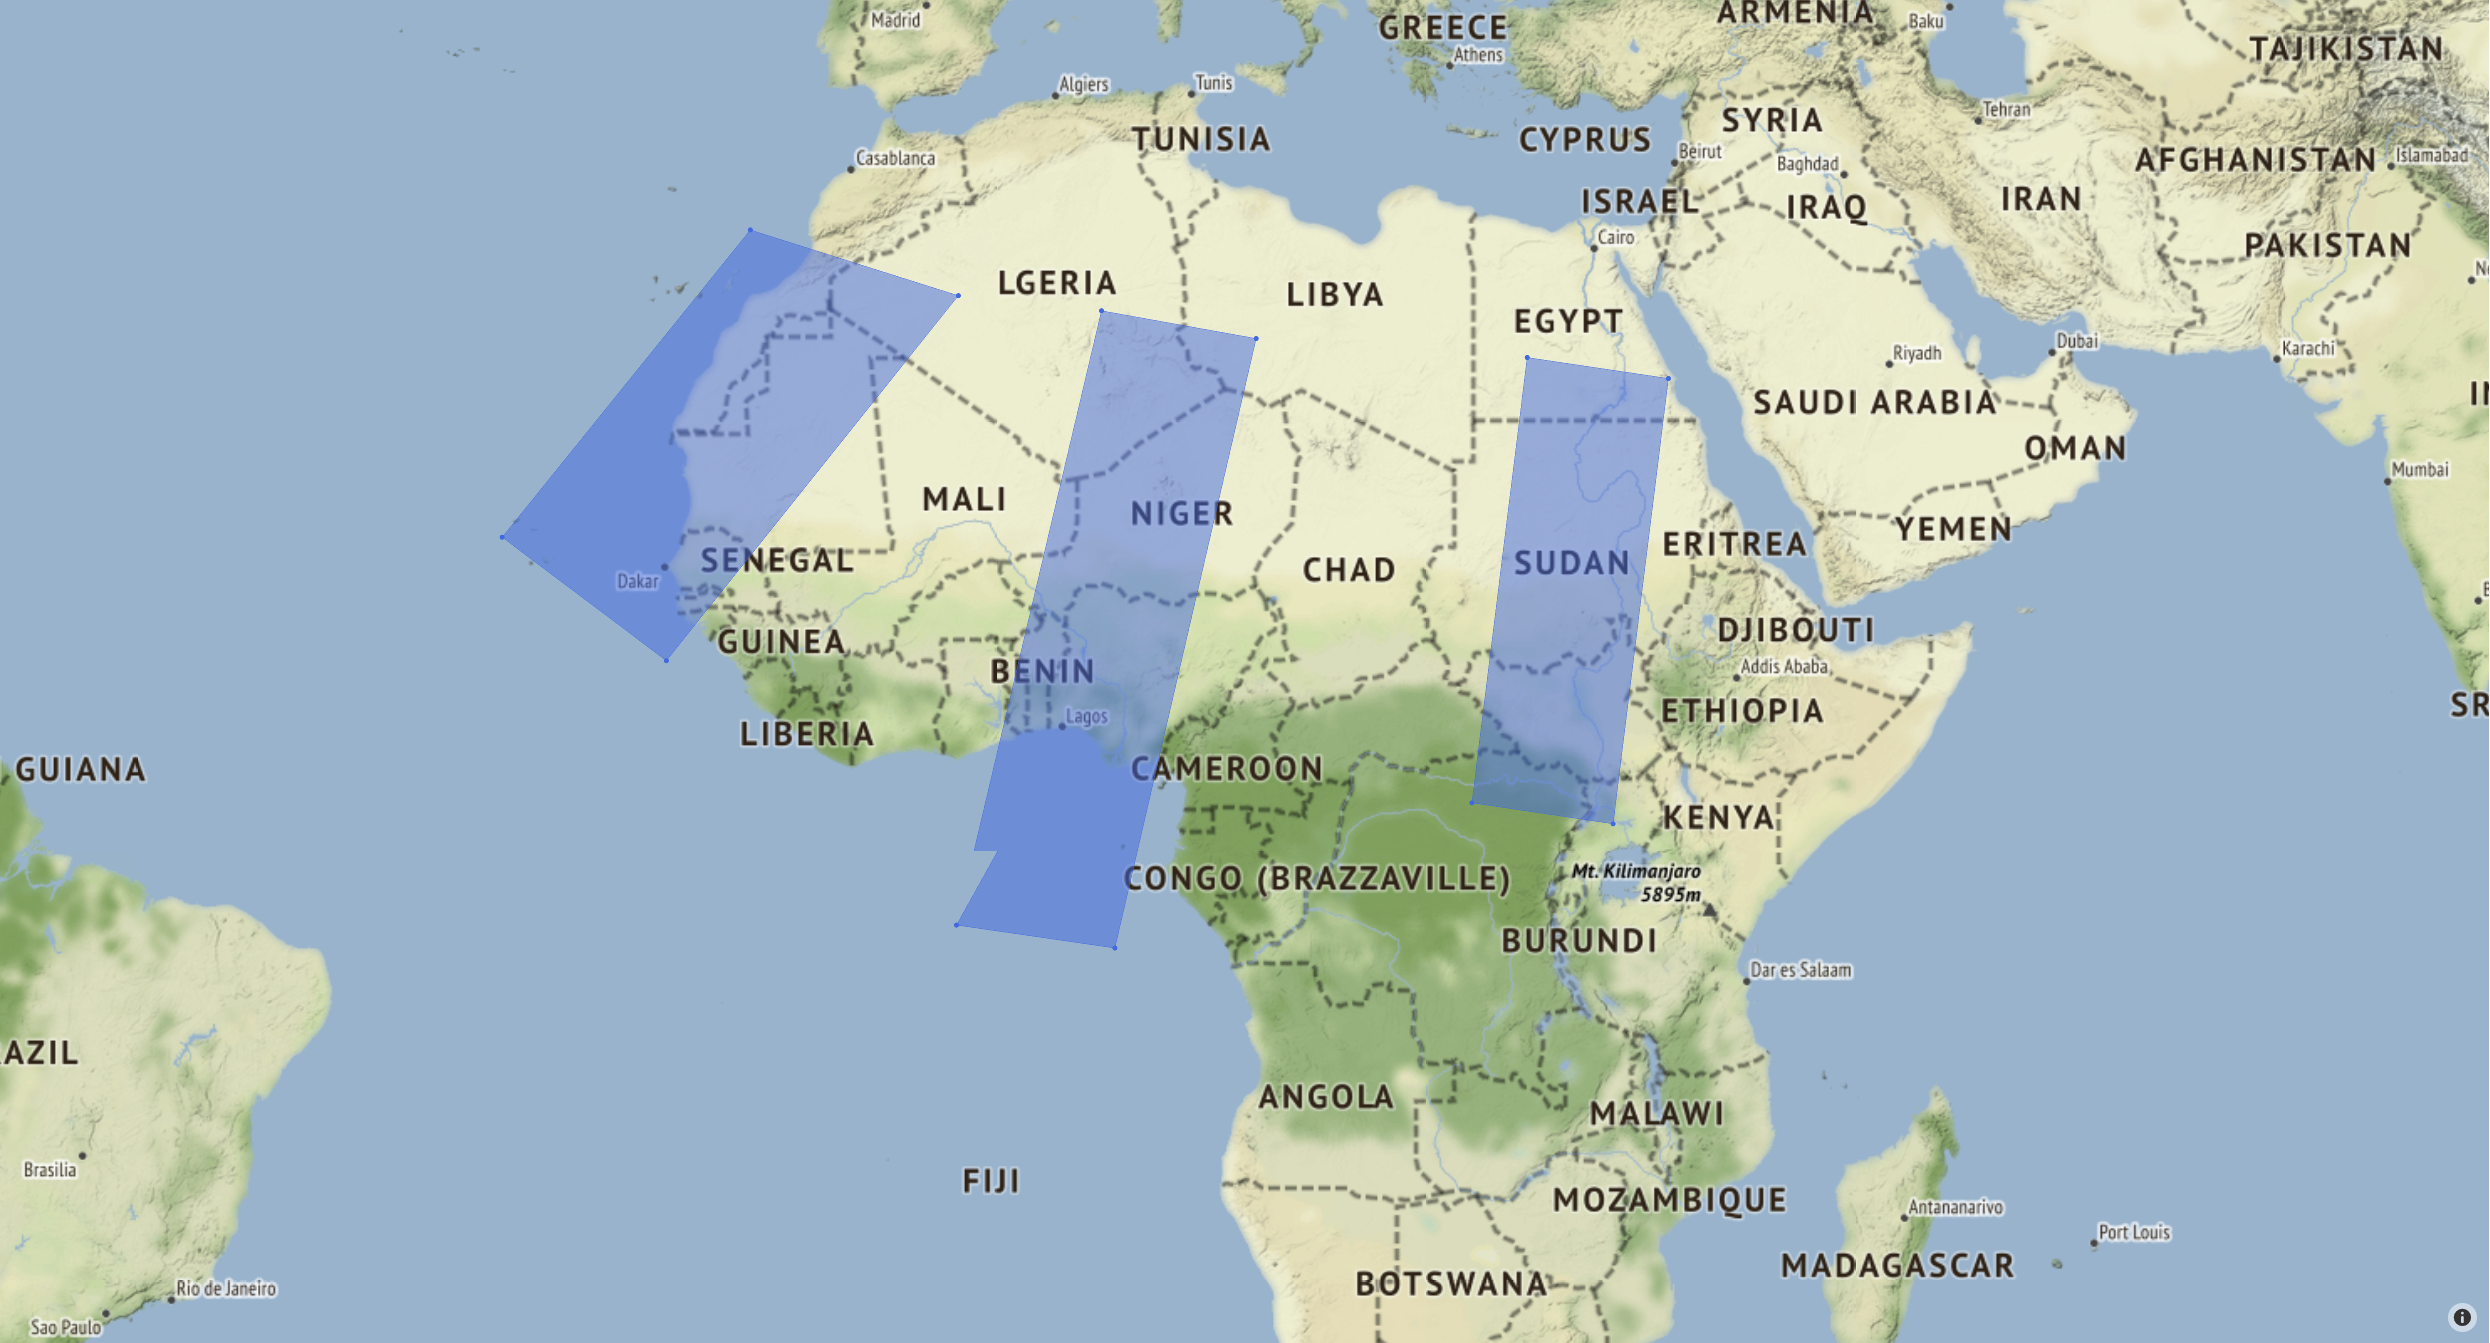
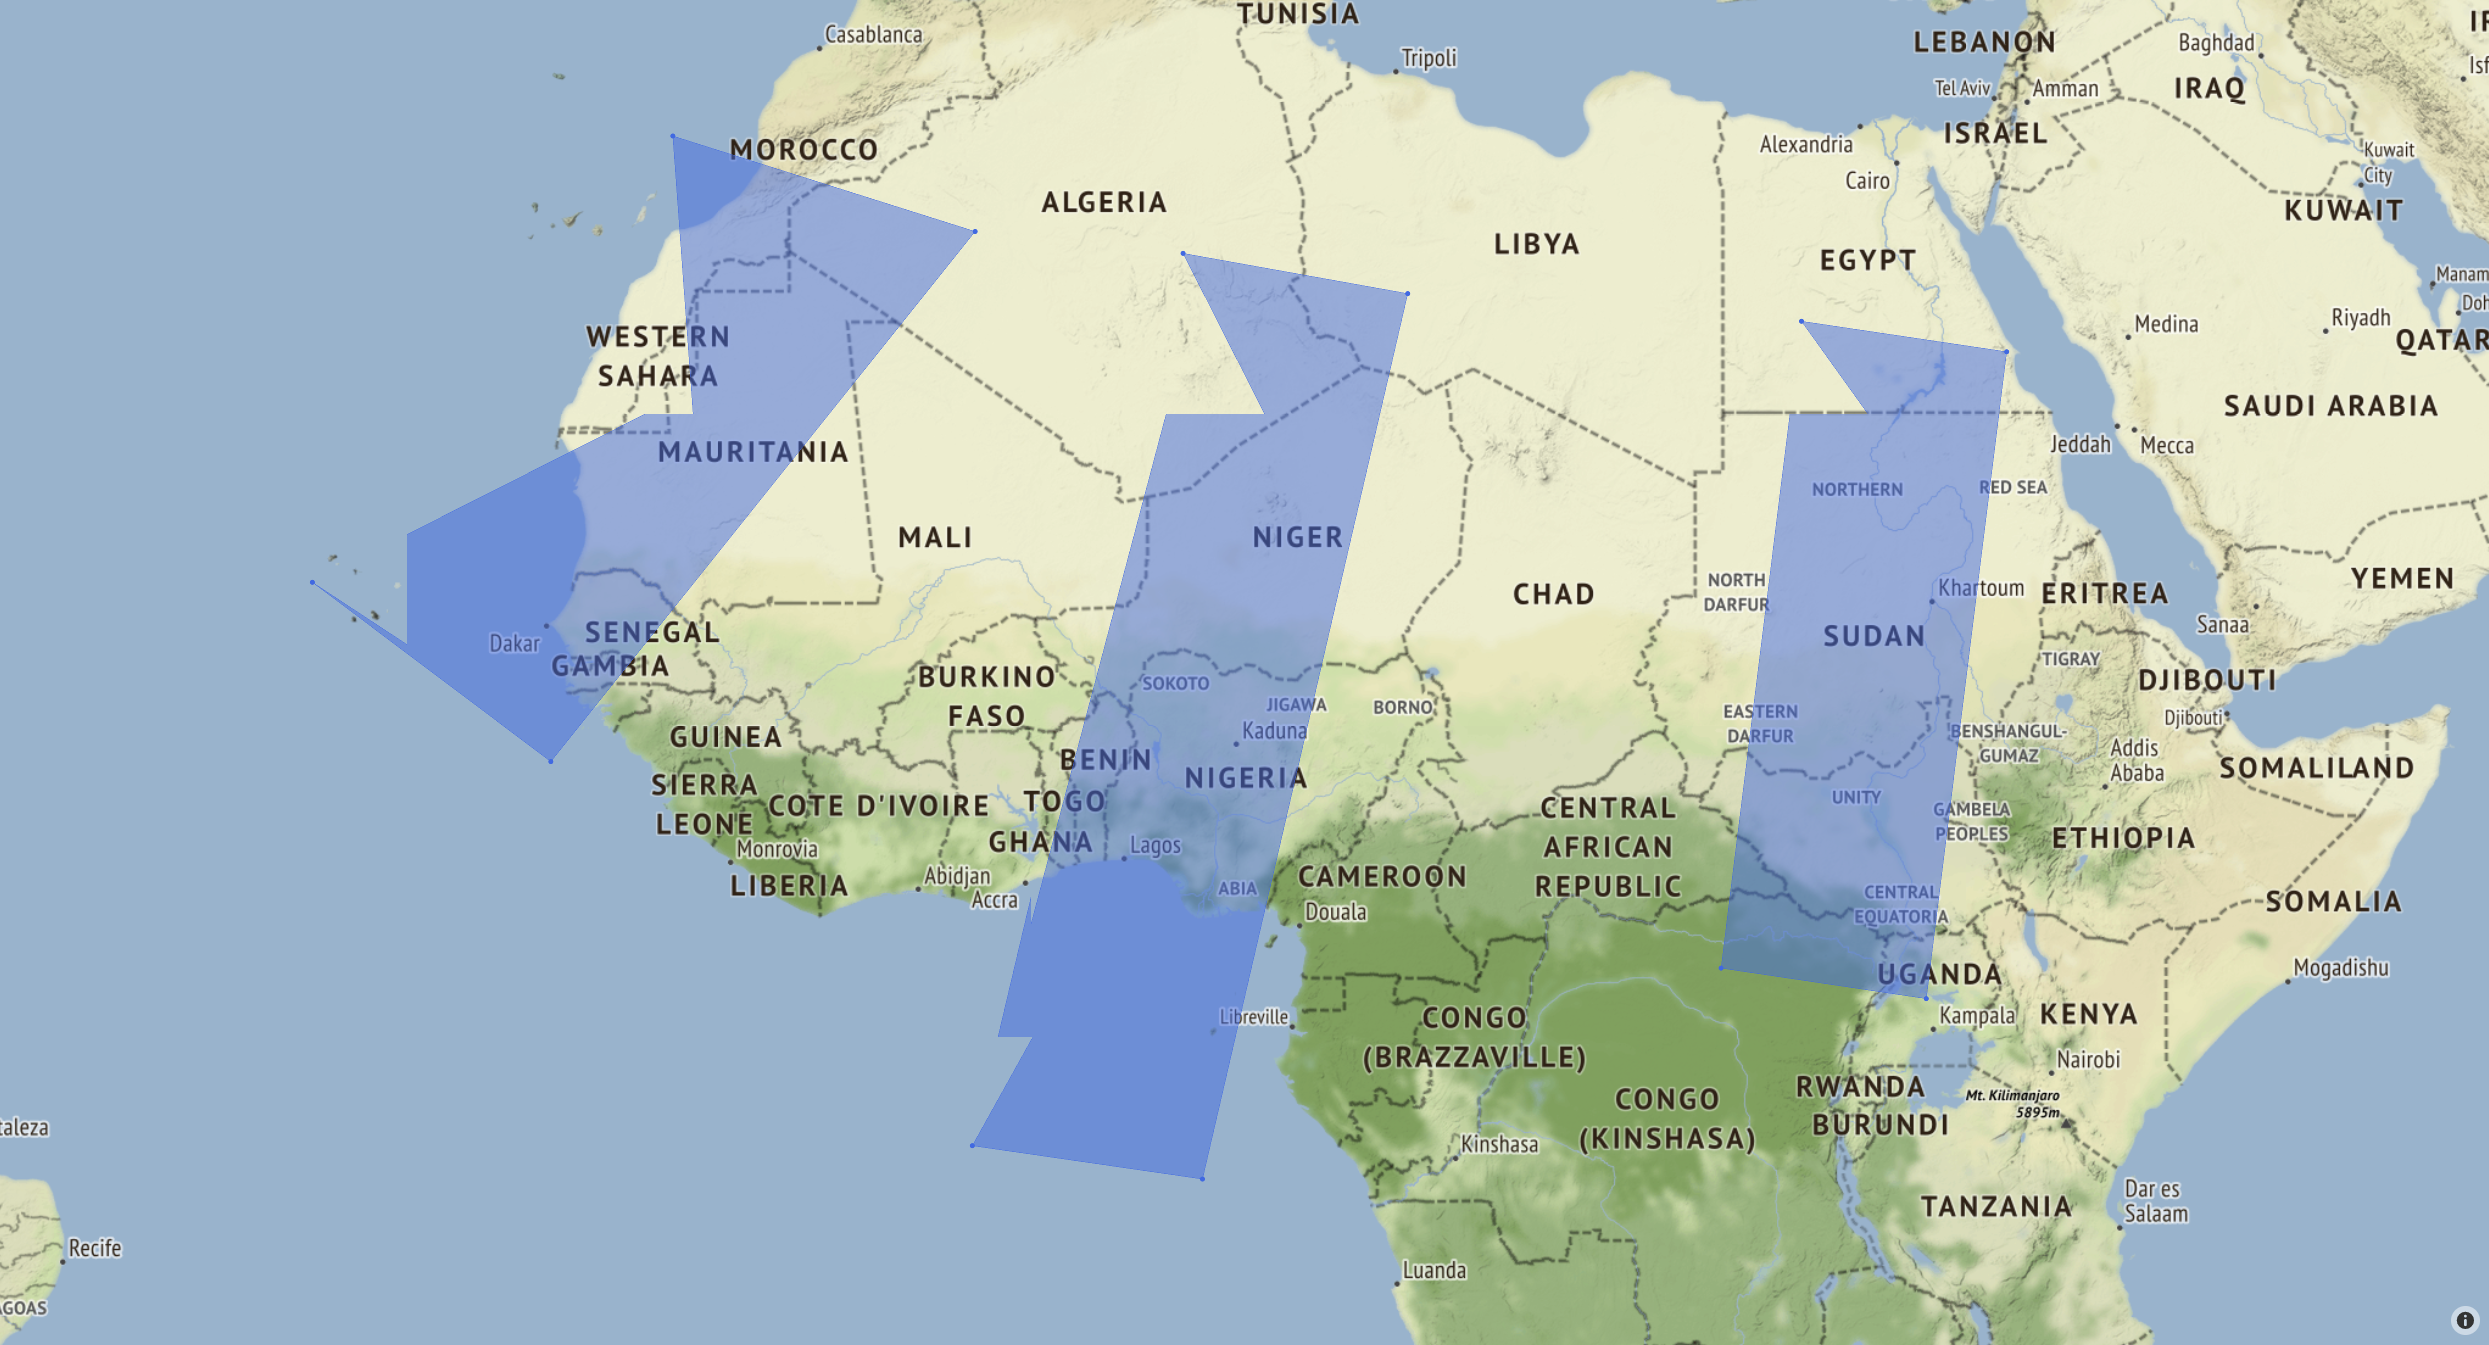
I'm plotting filled polygons on a map using Scattermapbox. It successfully plots the corner markers, but doesn't show a straight line between the two points, seen in the first image. When zooming in on the map, it makes even more jagged lines on all the polygons, seen in the second image.
I tried running the code and opening the .html file on both a windows and linux machine, with the same results.
Specifications
- Windows 10
- Chrome 92.0.4515.131
- python 3.8.11
- plotly 5.1.0
Issue also appears with:
- Ubuntu 18.0.45
- Firefox 91.0 / Edge 91.0.864.64
- python 3.6.9
- plotly 4.14.3
Code to produce the images
import numpy as np
import plotly.graph_objects as go

corners1 = np.array([[5.5, 13.6, 6.2, -2.1], [27.2, 25.9, -5.1, -3.9]])
corners2 = np.array([[-12.9, -2.0, -17.3, -25.9], [30.9, 27.9, 9.9, 16.2]])
corners3 = np.array([[27.8, 35.2, 32.3, 24.9], [25.0, 24.0, 1.4, 2.5]])

sat_corners = [corners1, corners2, corners3]

fig = go.Figure()
for corners in sat_corners:
    fig.add_trace(go.Scattermapbox(
        fill="toself",
        lat=corners[:][1],
        lon=corners[:][0],
        marker={'size': 5, 'color': 'royalblue'}))

fig.update_layout(
    mapbox={
        'style': "stamen-terrain",
        'center': {'lat': 11.547231, 'lon': -5.885243},
        'zoom': 3.5},
    showlegend=False,
    margin_t=20, margin_r=20, margin_b=20, margin_l=20
)

fig.show()
fig.write_html('test_map.html')
fig.write_image('test_map.png', width=1000, height=1000, engine='kaleido')
Resulting Images
These images are screengrabs from Chrome:
Dog leg is visible in the lower left corner of the center polygon.
Here, jagged lines are visible on all polygons. Lines stay like this as far as you can zoom in.
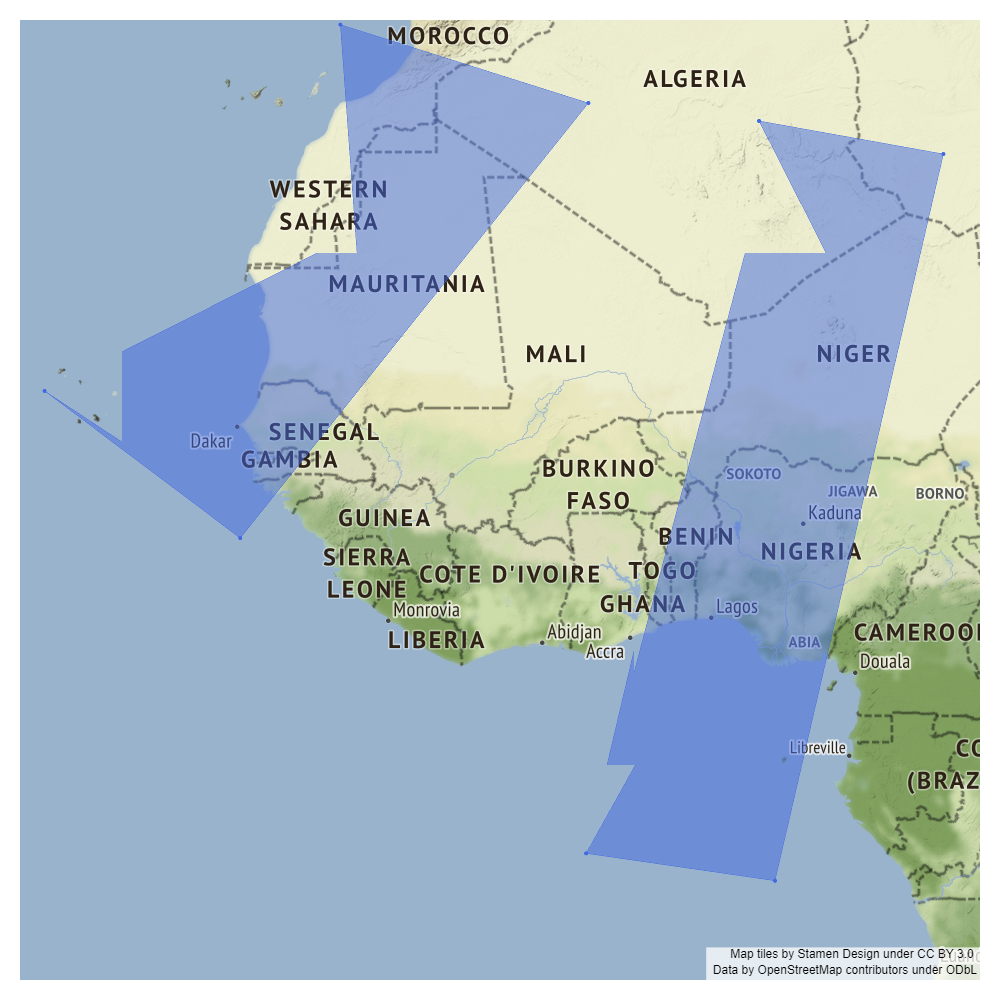
These images are the .png files with different zoom parameters given in fig.update_layout:
zoom=4:
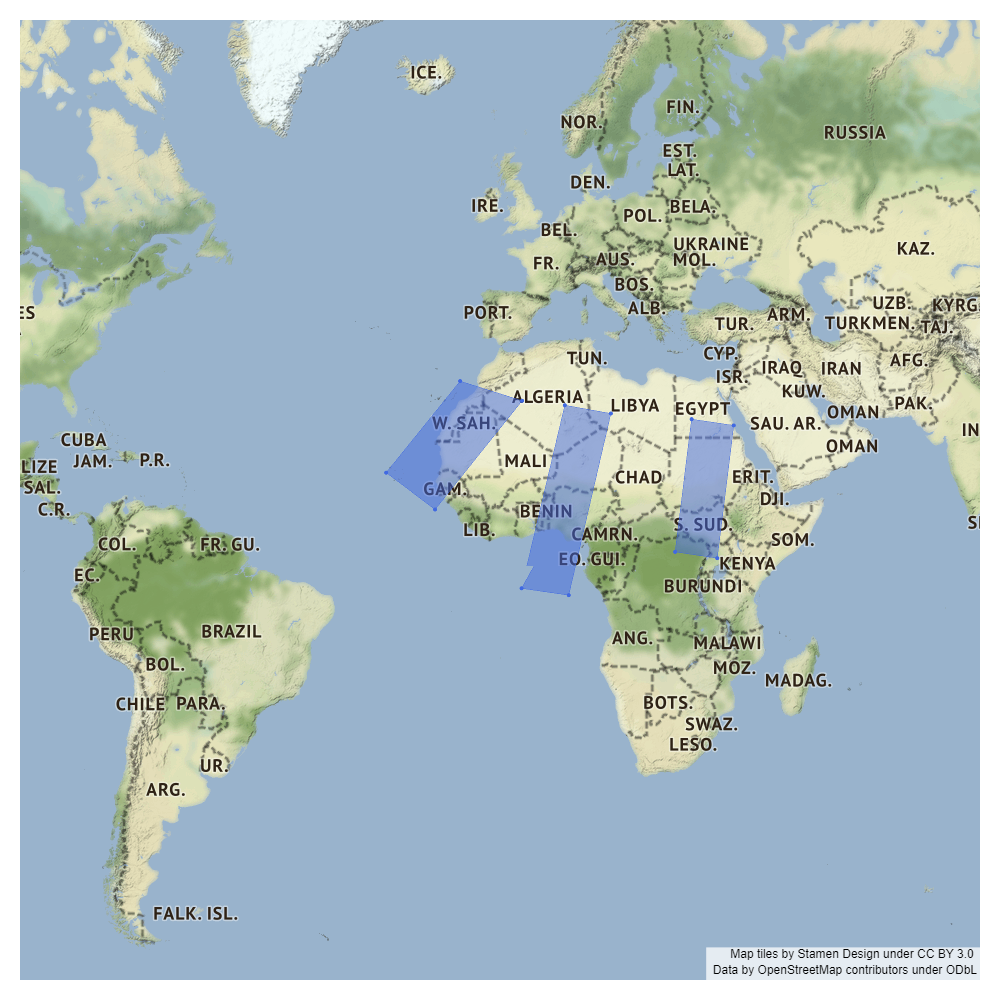
zoom=3:

zoom=2:
贡献指南
从这里开始
- 先读完整个 Issue,再读项目的贡献指南。
- 在 Issue 下留言说明你要接手 —— 这能避免两个人做同样的事。
- Fork 仓库,在一个分支上完成修改。
- 提交 Pull Request,并在描述里引用这个 Issue 编号。
调研方向
首先,使用列出的多边形坐标运行提供的 Scattermapbox 示例,并比较不同缩放级别下的交互式 HTML 输出与生成的 PNG。调查 Scattermapbox 填充的渲染路径,并在报告的浏览器和 Plotly 版本中验证结果。多边形边缘能够渲染为直线,且没有报告的锯齿伪影,即表示完成。
由索引模型根据 Issue 内容生成。
评估
- 技术栈
- plotly, python
- 领域
- data-visualization
- Issue 类型
- 缺陷
- 难度
- 4/5
- 预计耗时
- 3-5 天
- 活跃度
- 停滞
- 描述清晰度
- 基本清楚
- 新手友好度
- 35/100