Scattermapbox fill plotting jagged lines
Dieses Issue hat noch niemand übernommen.
- Vorherrschende Sprache
- Python
- Sterne
- 18.8k
- Forks
- 2.8k
- Ø Merge
- 16 Std. 26 Min.
- Gemergte PRs (30 T.)
- 21
Beschreibung
Issue
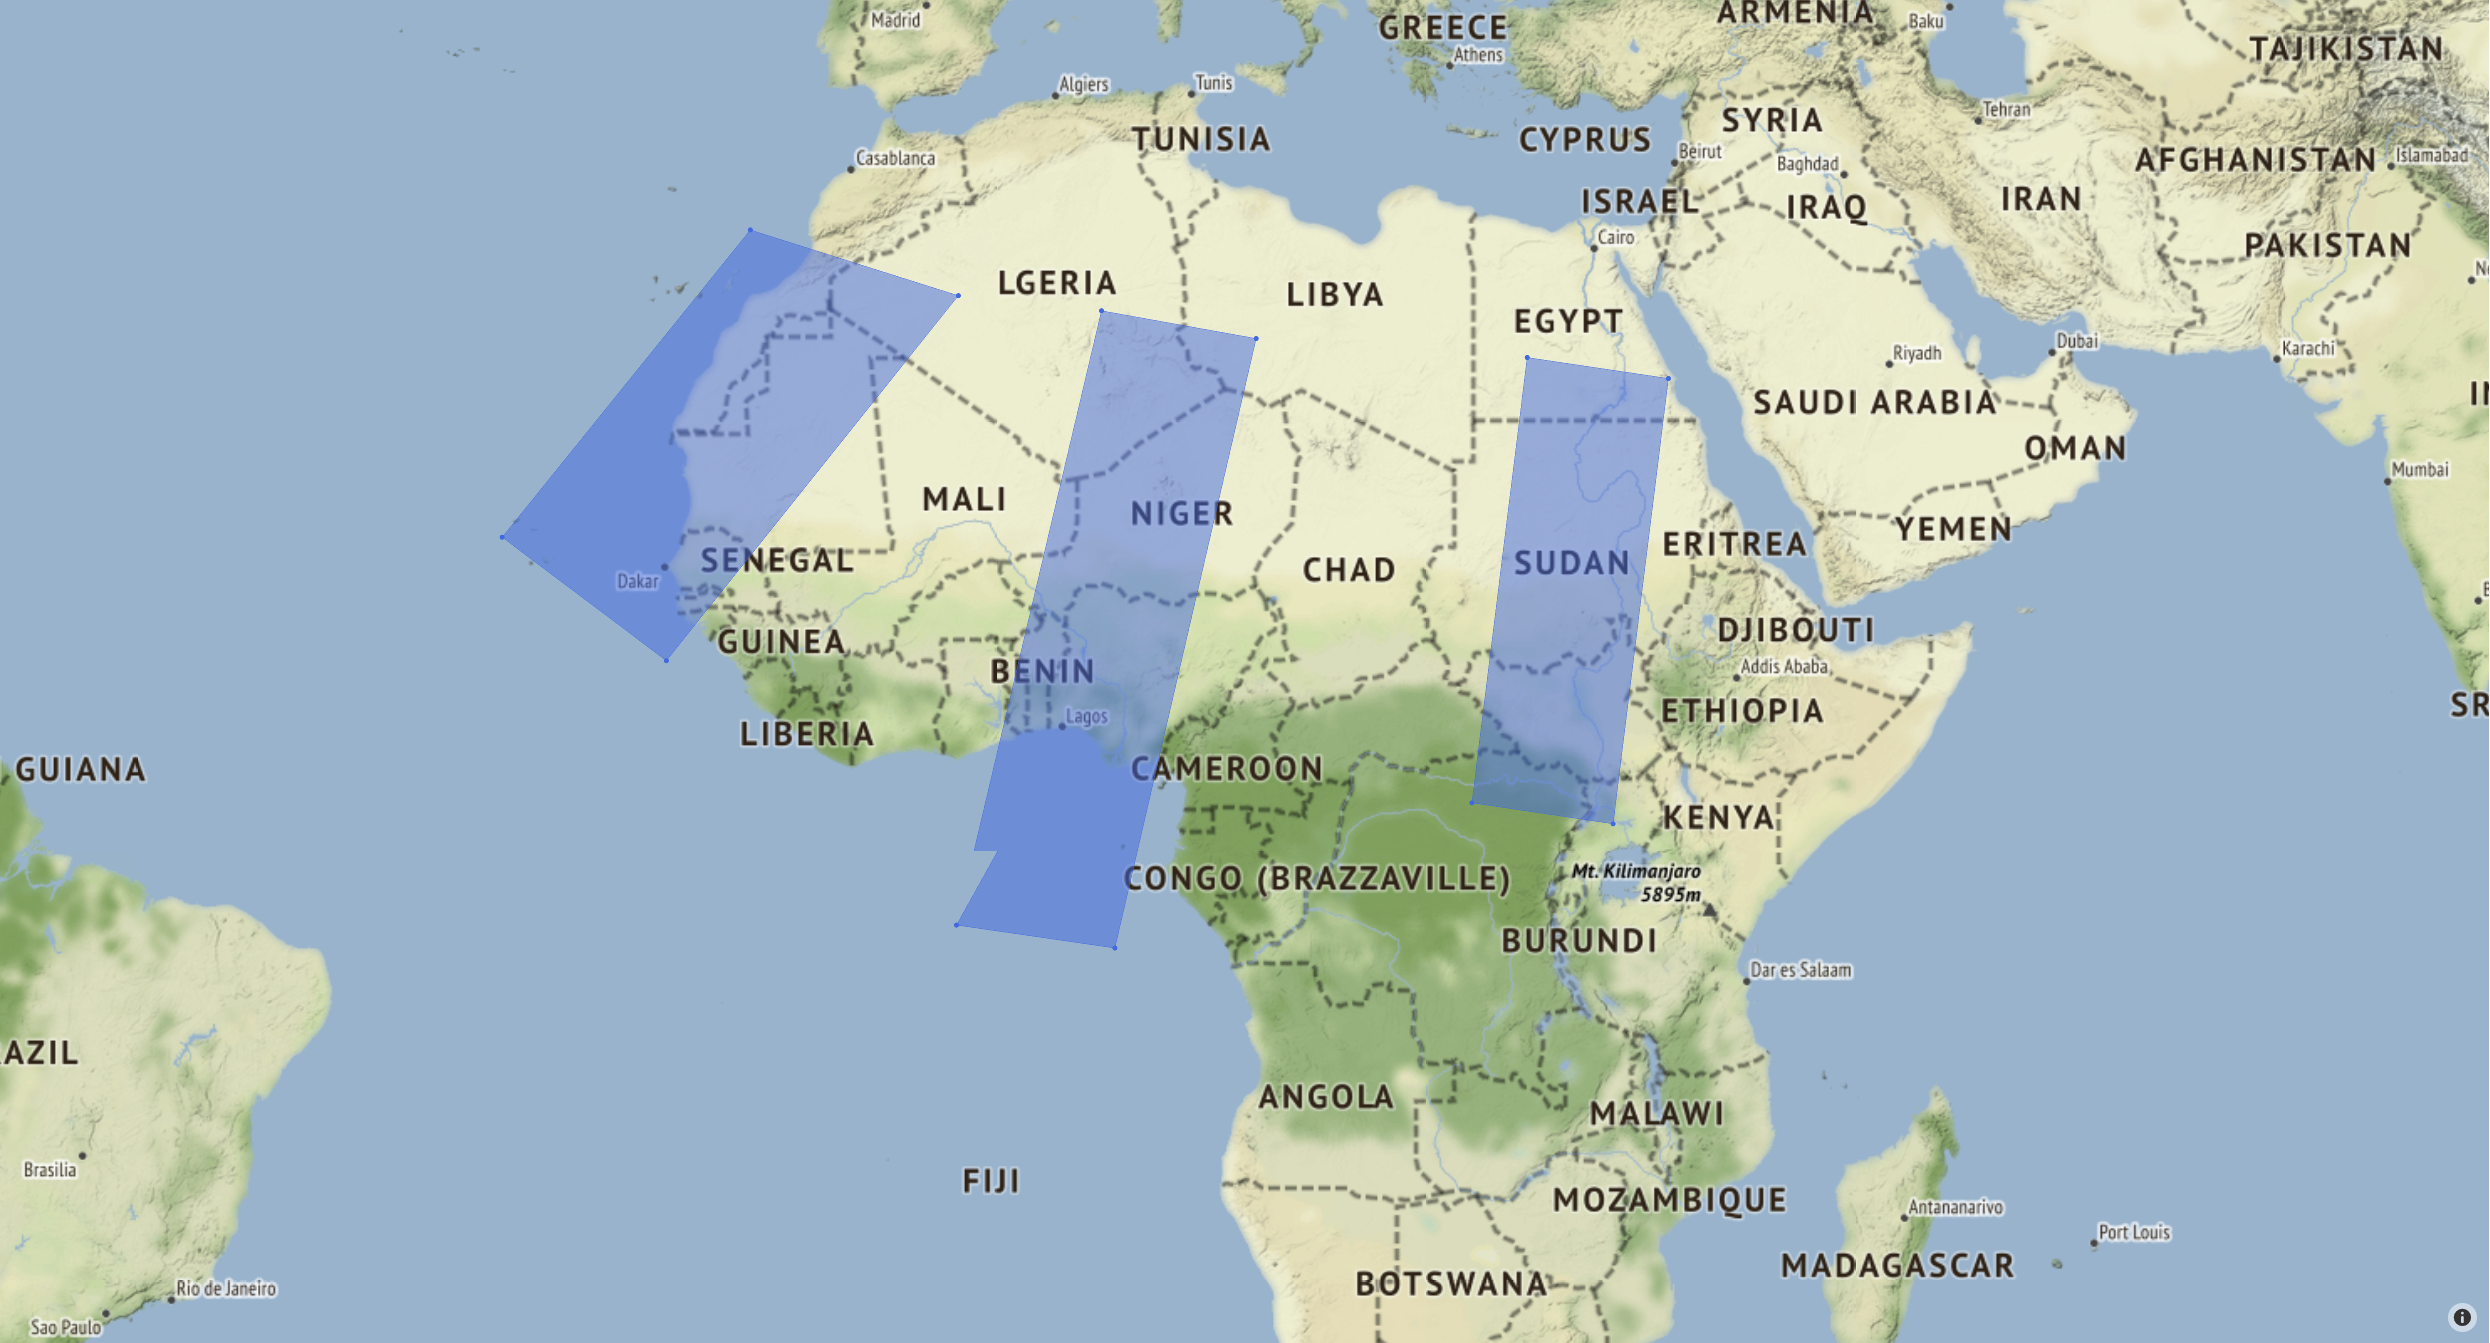
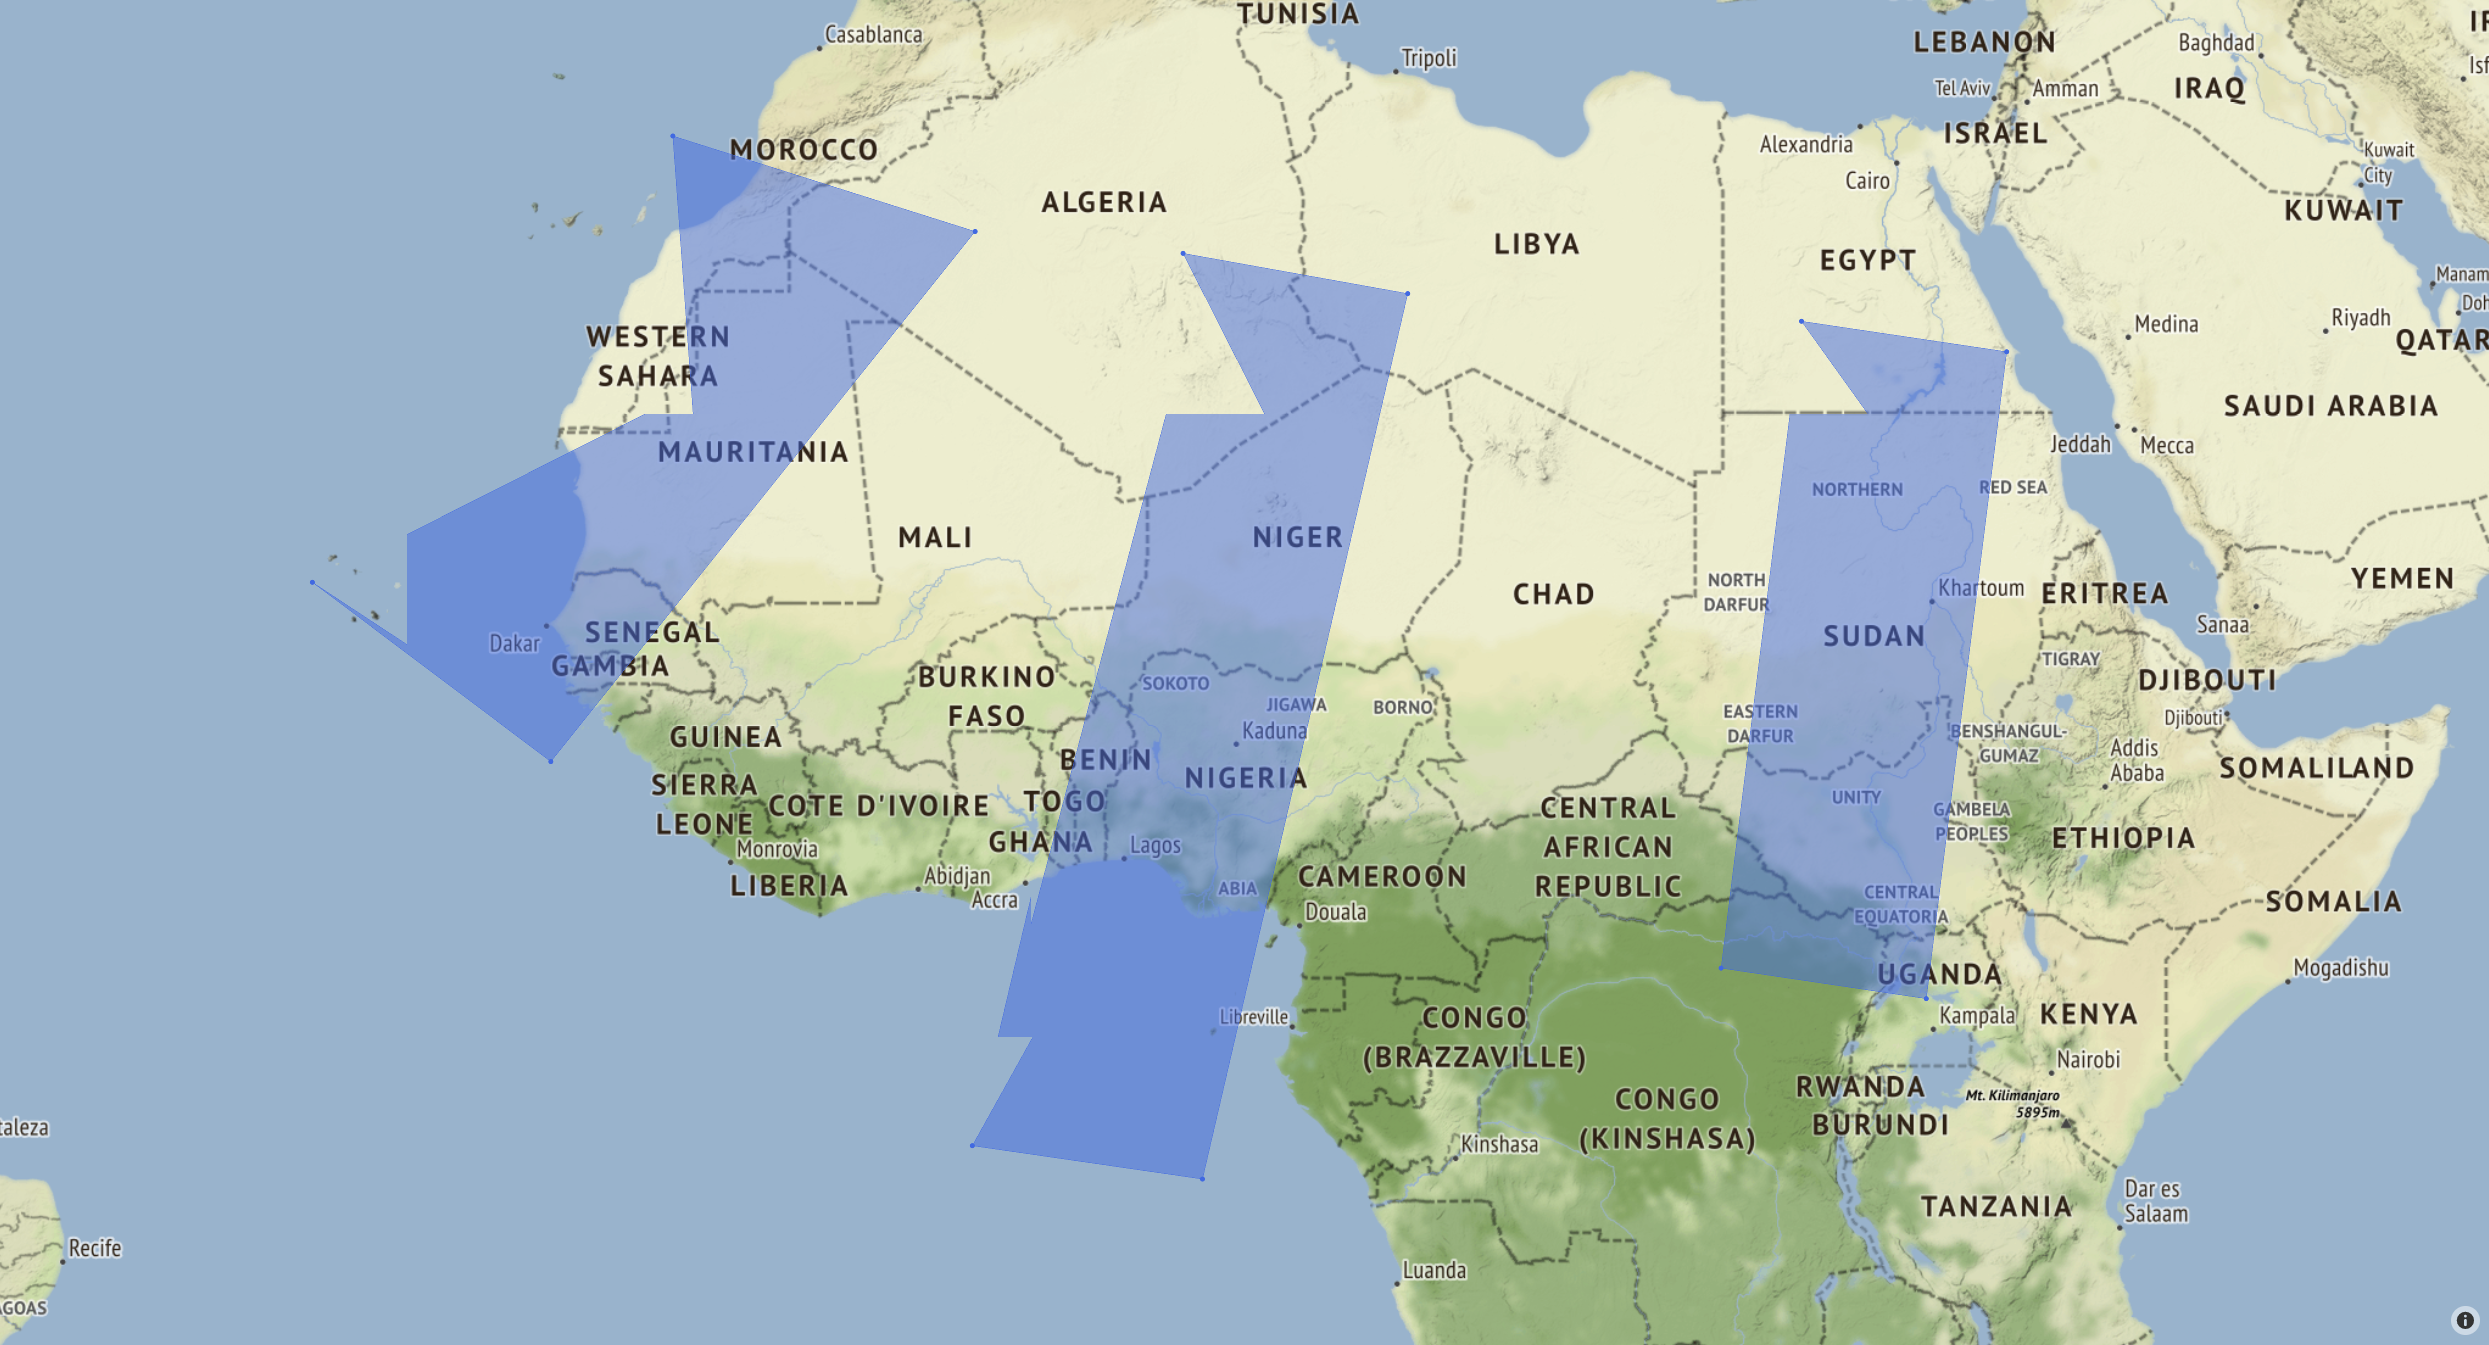
I'm plotting filled polygons on a map using Scattermapbox. It successfully plots the corner markers, but doesn't show a straight line between the two points, seen in the first image. When zooming in on the map, it makes even more jagged lines on all the polygons, seen in the second image.
I tried running the code and opening the .html file on both a windows and linux machine, with the same results.
Specifications
- Windows 10
- Chrome 92.0.4515.131
- python 3.8.11
- plotly 5.1.0
Issue also appears with:
- Ubuntu 18.0.45
- Firefox 91.0 / Edge 91.0.864.64
- python 3.6.9
- plotly 4.14.3
Code to produce the images
import numpy as np
import plotly.graph_objects as go

corners1 = np.array([[5.5, 13.6, 6.2, -2.1], [27.2, 25.9, -5.1, -3.9]])
corners2 = np.array([[-12.9, -2.0, -17.3, -25.9], [30.9, 27.9, 9.9, 16.2]])
corners3 = np.array([[27.8, 35.2, 32.3, 24.9], [25.0, 24.0, 1.4, 2.5]])

sat_corners = [corners1, corners2, corners3]

fig = go.Figure()
for corners in sat_corners:
    fig.add_trace(go.Scattermapbox(
        fill="toself",
        lat=corners[:][1],
        lon=corners[:][0],
        marker={'size': 5, 'color': 'royalblue'}))

fig.update_layout(
    mapbox={
        'style': "stamen-terrain",
        'center': {'lat': 11.547231, 'lon': -5.885243},
        'zoom': 3.5},
    showlegend=False,
    margin_t=20, margin_r=20, margin_b=20, margin_l=20
)

fig.show()
fig.write_html('test_map.html')
fig.write_image('test_map.png', width=1000, height=1000, engine='kaleido')
Resulting Images
These images are screengrabs from Chrome:
Dog leg is visible in the lower left corner of the center polygon.
Here, jagged lines are visible on all polygons. Lines stay like this as far as you can zoom in.
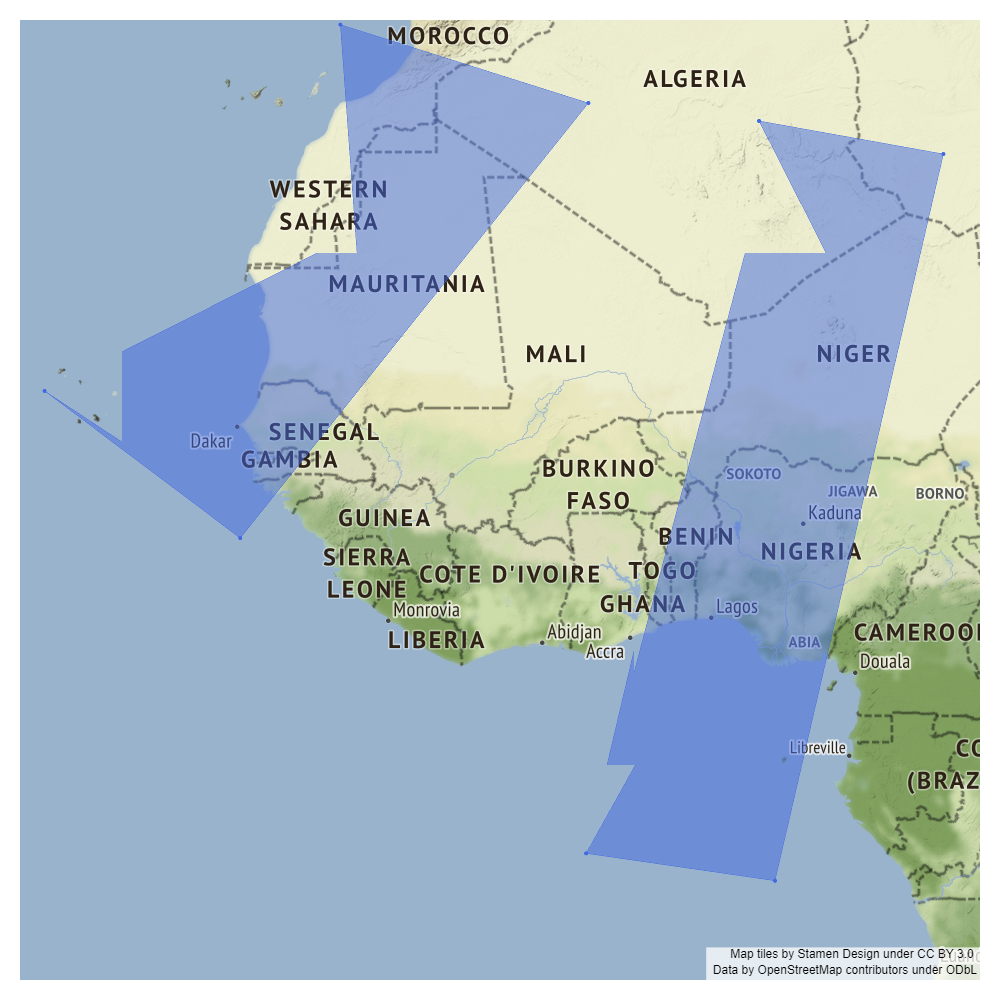
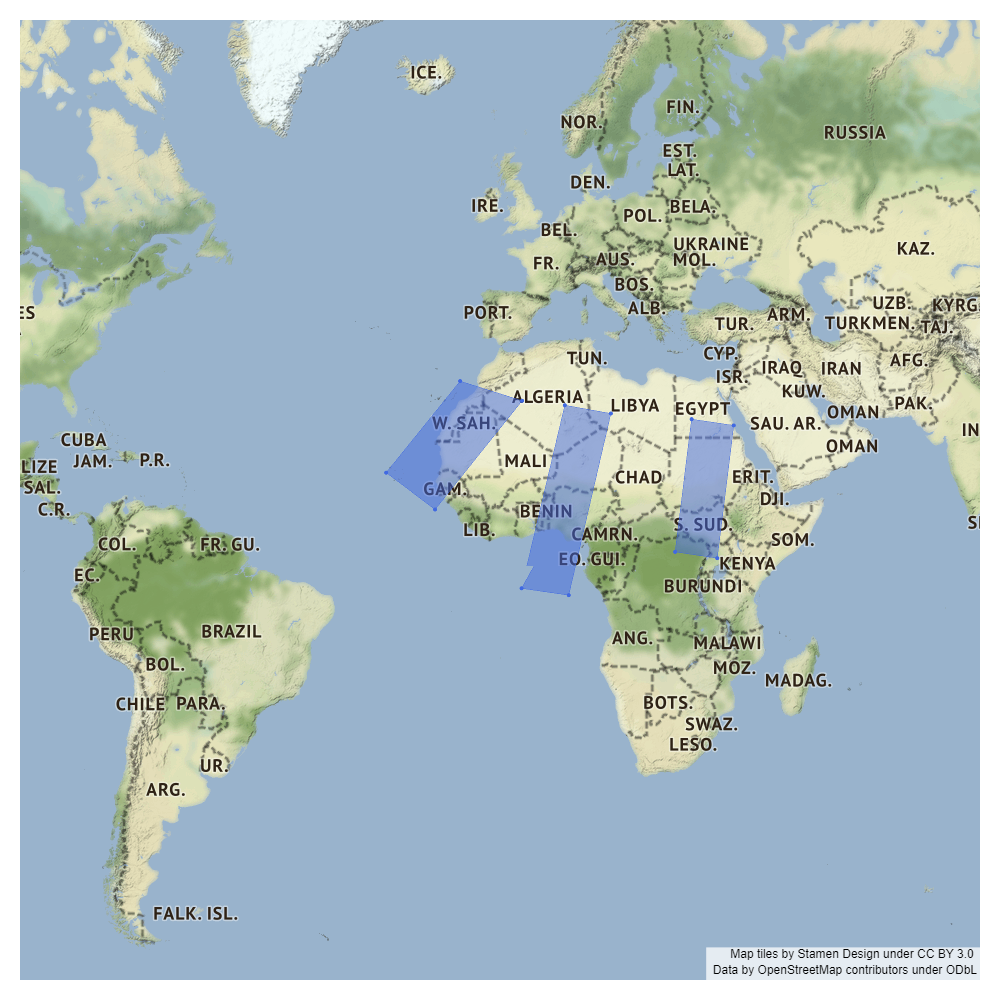
These images are the .png files with different zoom parameters given in fig.update_layout:
zoom=4:
zoom=3:

zoom=2:
Beitragsleitfaden
Erste Schritte
- Lies das ganze Issue und danach den Beitragsleitfaden des Projekts.
- Schreib ins Issue, dass du es übernimmst — das erspart doppelte Arbeit.
- Forke das Repository und arbeite in einem Branch.
- Öffne einen Pull Request, der die Issue-Nummer nennt.
Rechercherichtung
Führen Sie zunächst das bereitgestellte Scattermapbox-Beispiel mit den aufgeführten Polygonkoordinaten aus und vergleichen Sie die interaktive HTML-Ausgabe mit dem generierten PNG bei verschiedenen Zoomstufen. Untersuchen Sie den Rendering-Pfad für die Scattermapbox-Füllung und überprüfen Sie das Ergebnis mit den gemeldeten Browser- und Plotly-Versionen. Als abgeschlossen gilt die Aufgabe, wenn die Polygonkanten als gerade Linien ohne die gemeldeten gezackten Artefakte gerendert werden.
Vom Indexierungsmodell aus dem Issue-Text verfasst.
Bewertung
- Tech-Stack
- plotly, python
- Bereich
- data-visualization
- Issue-Typ
- Bug
- Schwierigkeit
- 4/5
- Geschätzter Aufwand
- 3-5 Tage
- Aktivitätsstatus
- Veraltet
- Klarheit
- Größtenteils klar
- Anfängerfreundlichkeit
- 35/100