Scattermapbox fill plotting jagged lines
まだ誰も着手していません。
- 主要言語
- Python
- スター
- 18.8k
- フォーク
- 2.8k
- 平均マージ
- 16時間 26分
- マージ済み PR(30日)
- 21
説明
Issue
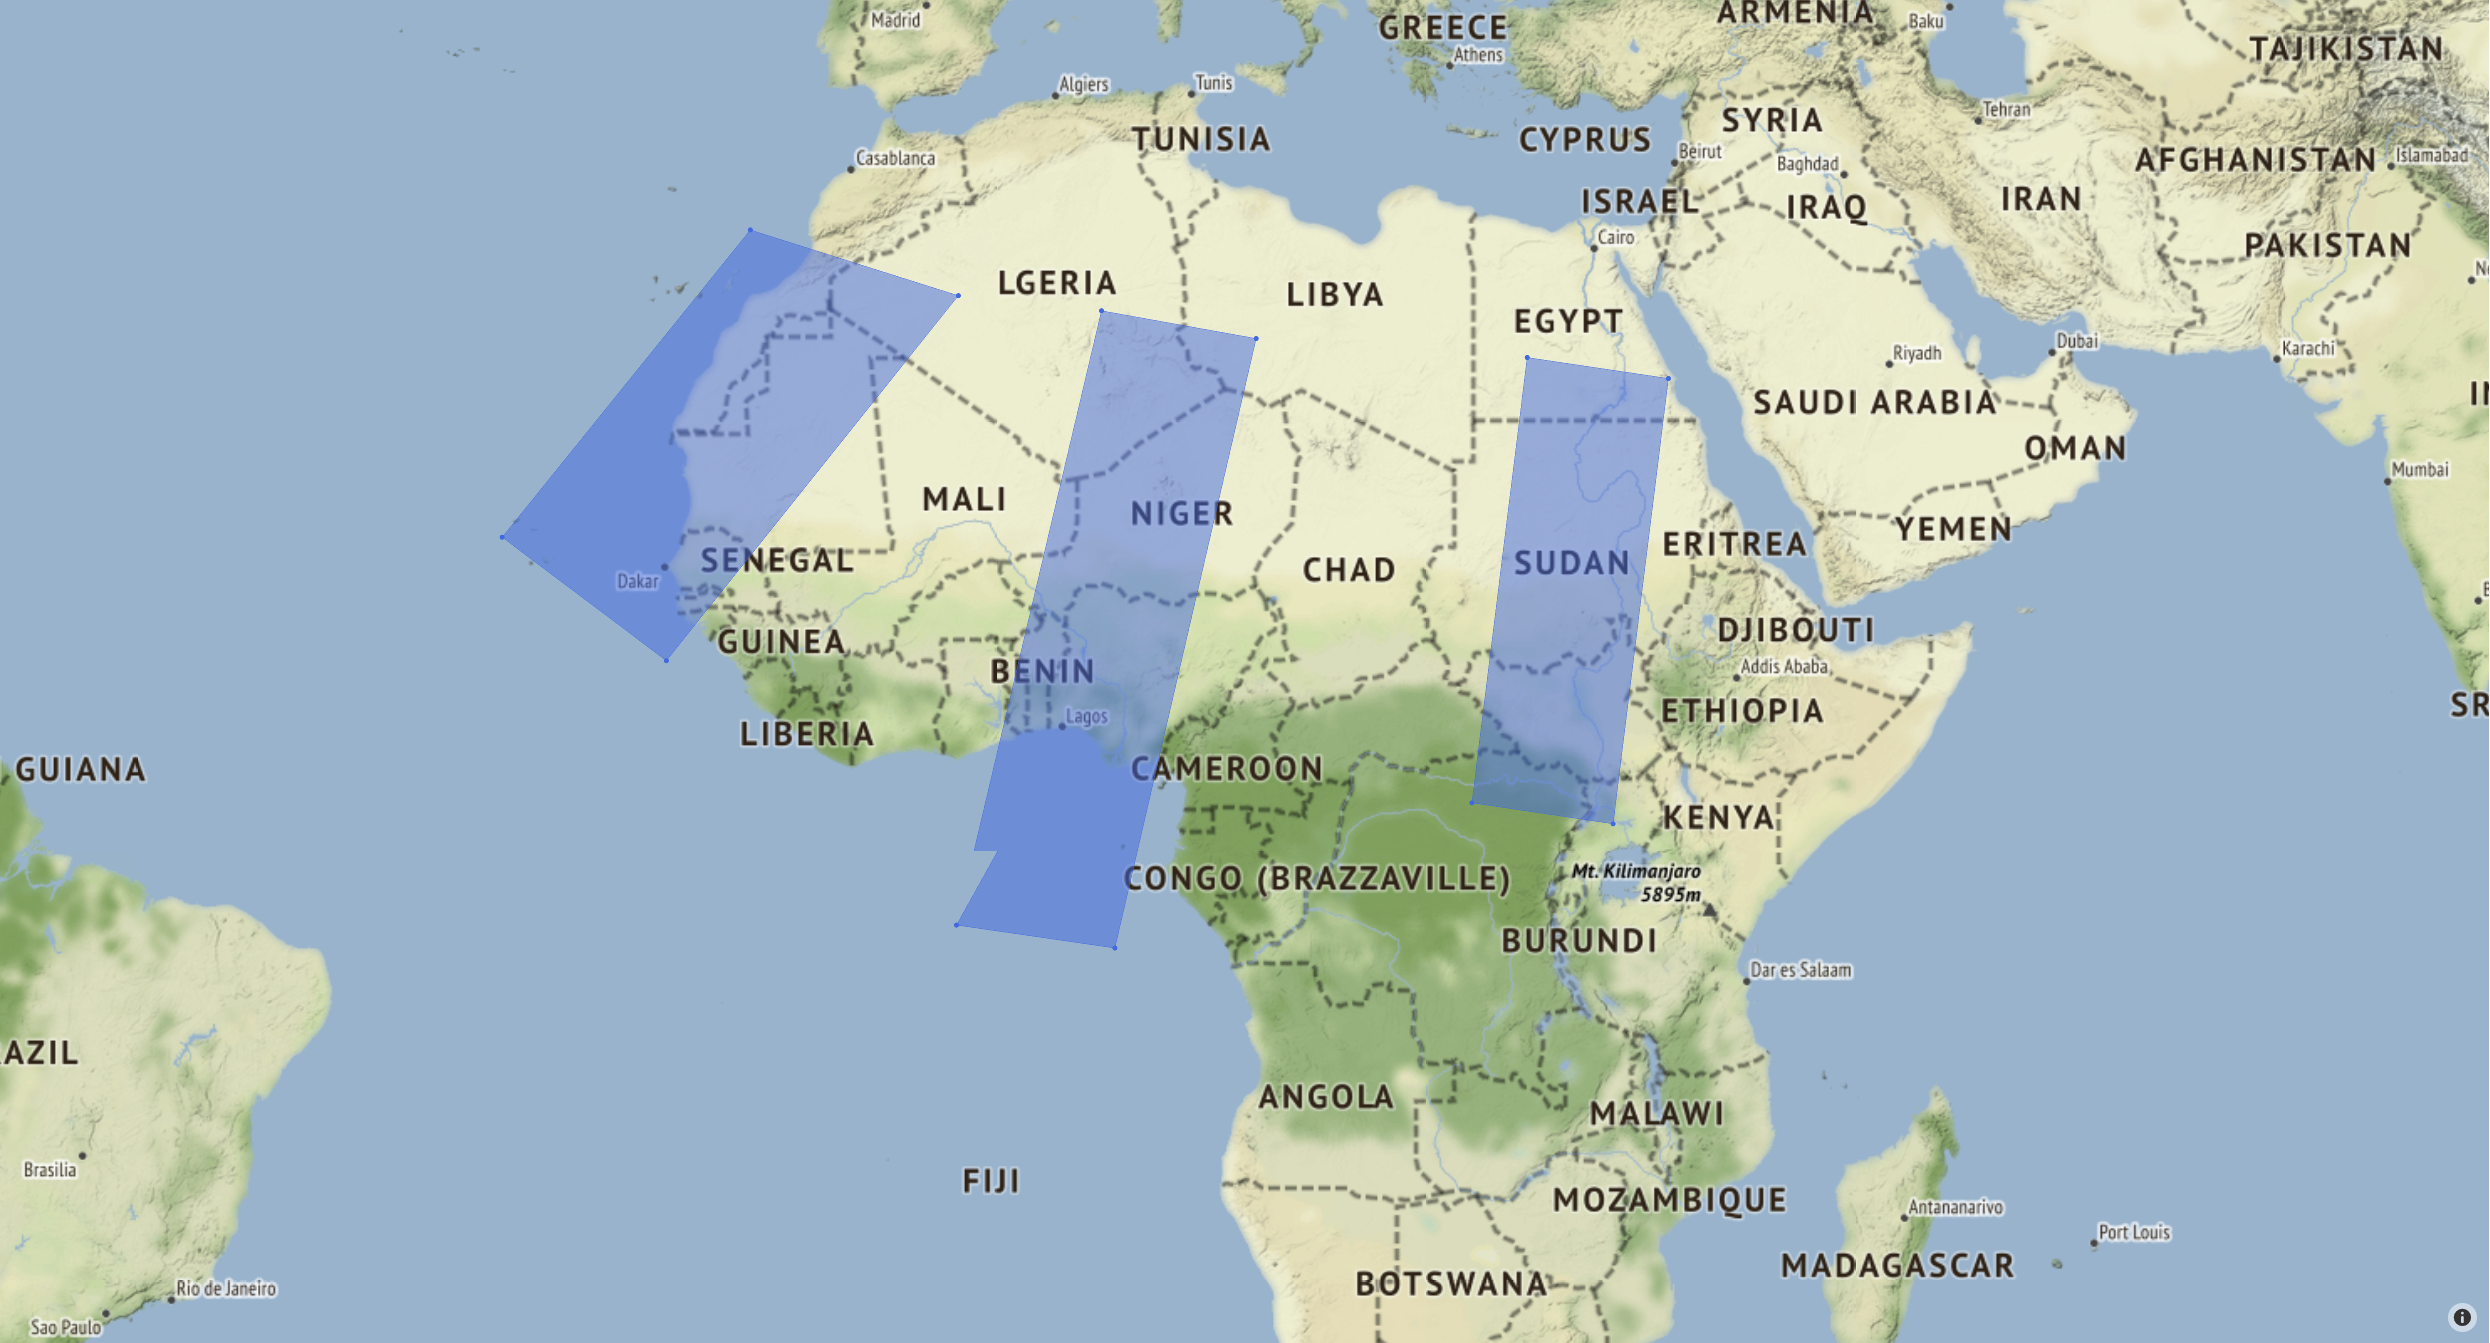
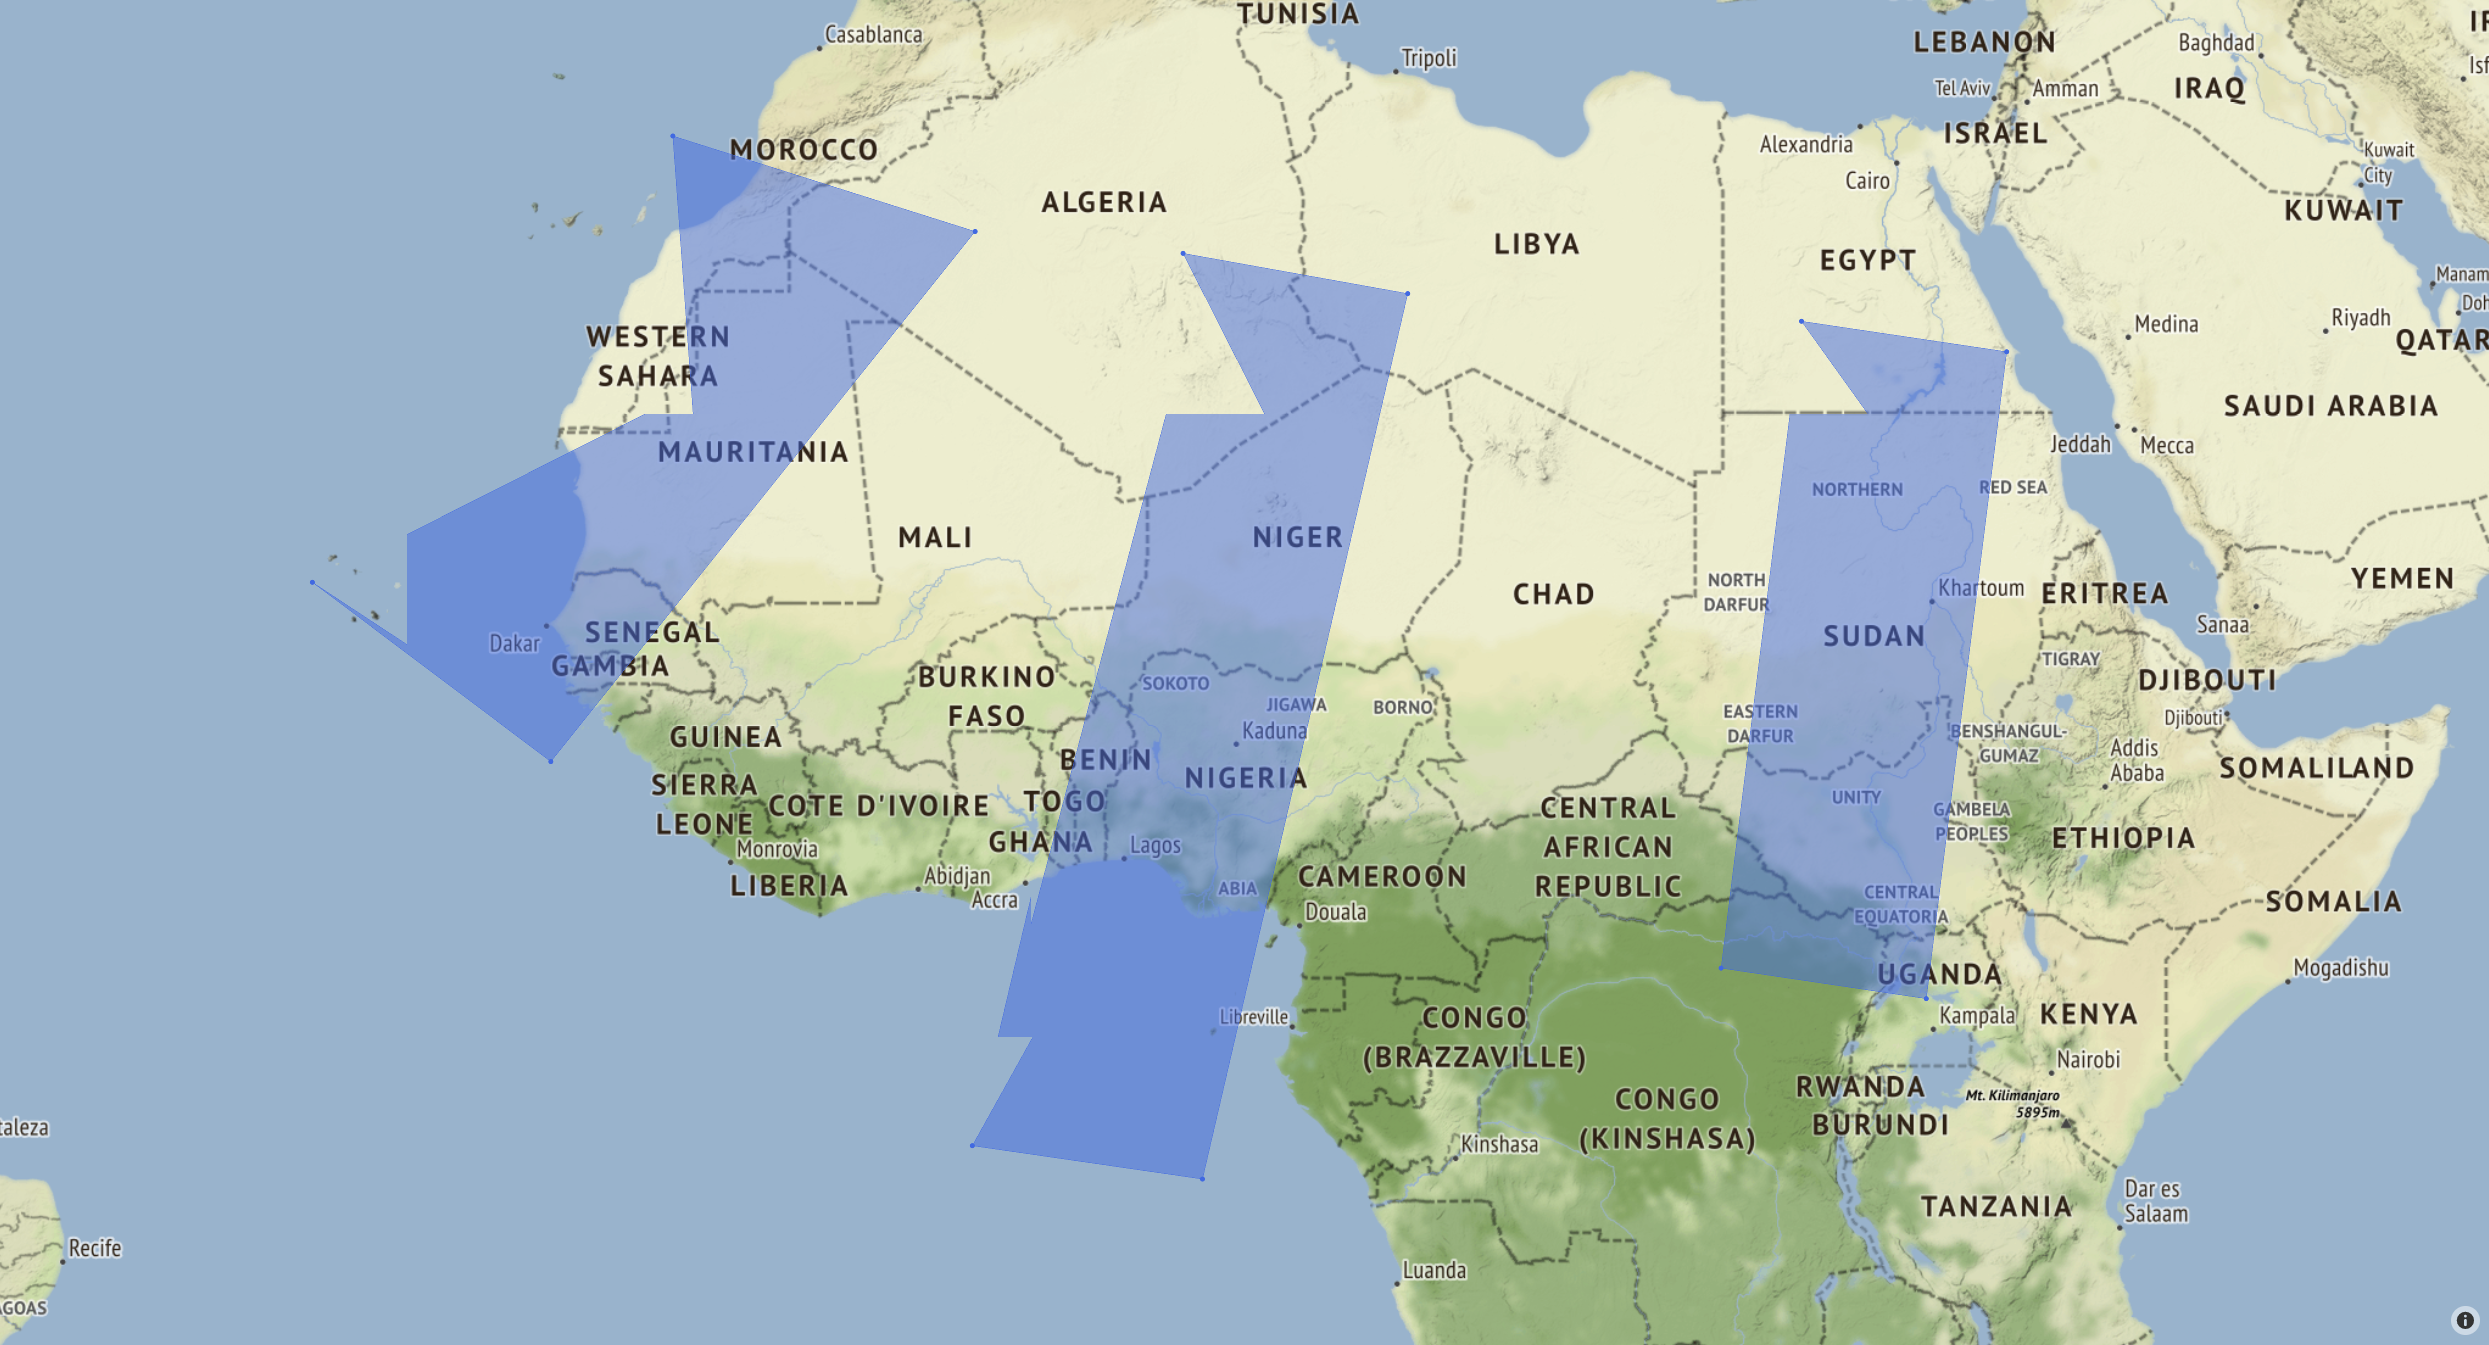
I'm plotting filled polygons on a map using Scattermapbox. It successfully plots the corner markers, but doesn't show a straight line between the two points, seen in the first image. When zooming in on the map, it makes even more jagged lines on all the polygons, seen in the second image.
I tried running the code and opening the .html file on both a windows and linux machine, with the same results.
Specifications
- Windows 10
- Chrome 92.0.4515.131
- python 3.8.11
- plotly 5.1.0
Issue also appears with:
- Ubuntu 18.0.45
- Firefox 91.0 / Edge 91.0.864.64
- python 3.6.9
- plotly 4.14.3
Code to produce the images
import numpy as np
import plotly.graph_objects as go

corners1 = np.array([[5.5, 13.6, 6.2, -2.1], [27.2, 25.9, -5.1, -3.9]])
corners2 = np.array([[-12.9, -2.0, -17.3, -25.9], [30.9, 27.9, 9.9, 16.2]])
corners3 = np.array([[27.8, 35.2, 32.3, 24.9], [25.0, 24.0, 1.4, 2.5]])

sat_corners = [corners1, corners2, corners3]

fig = go.Figure()
for corners in sat_corners:
    fig.add_trace(go.Scattermapbox(
        fill="toself",
        lat=corners[:][1],
        lon=corners[:][0],
        marker={'size': 5, 'color': 'royalblue'}))

fig.update_layout(
    mapbox={
        'style': "stamen-terrain",
        'center': {'lat': 11.547231, 'lon': -5.885243},
        'zoom': 3.5},
    showlegend=False,
    margin_t=20, margin_r=20, margin_b=20, margin_l=20
)

fig.show()
fig.write_html('test_map.html')
fig.write_image('test_map.png', width=1000, height=1000, engine='kaleido')
Resulting Images
These images are screengrabs from Chrome:
Dog leg is visible in the lower left corner of the center polygon.
Here, jagged lines are visible on all polygons. Lines stay like this as far as you can zoom in.
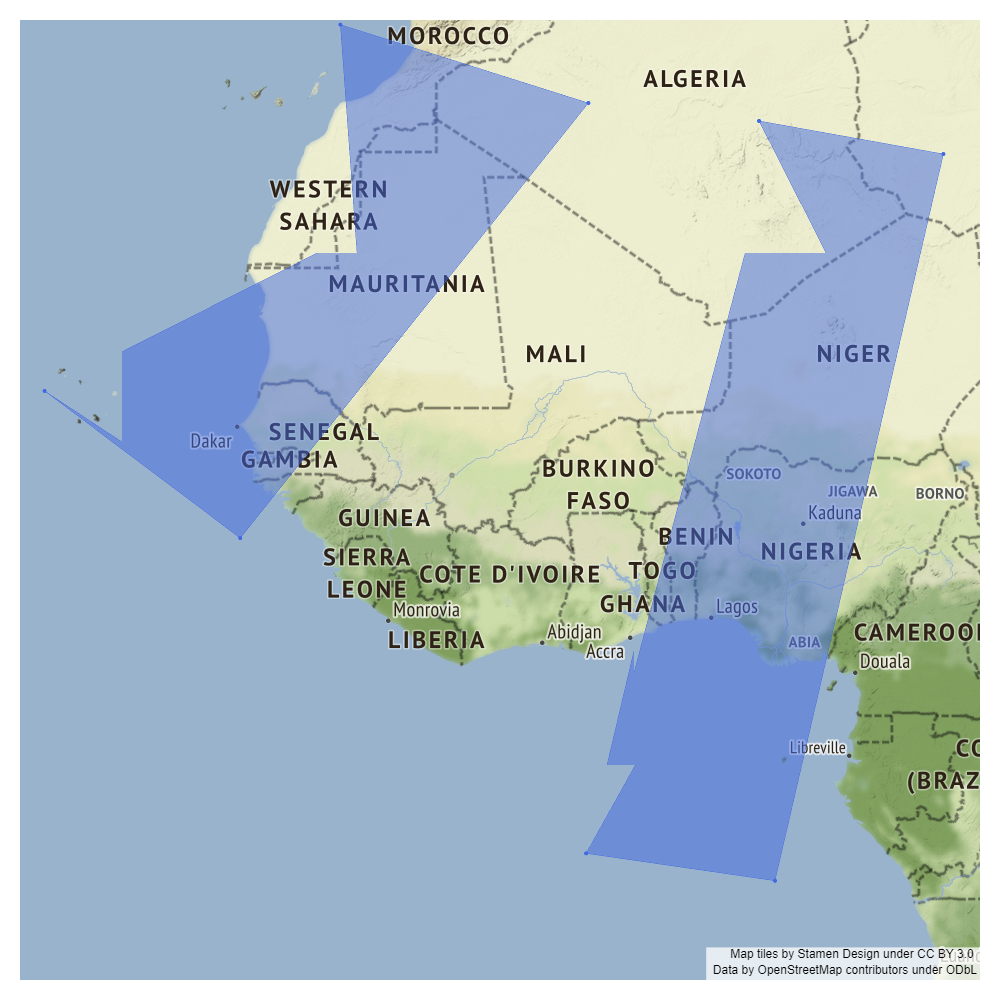
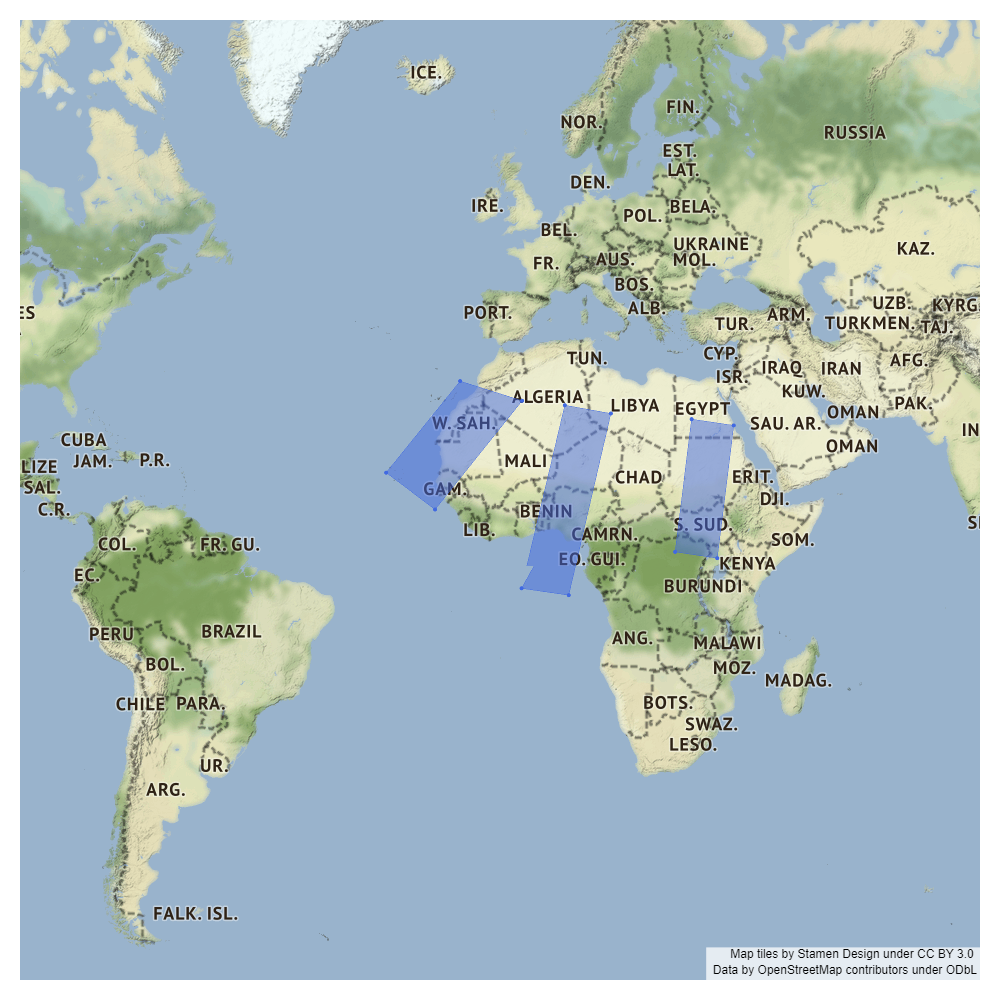
These images are the .png files with different zoom parameters given in fig.update_layout:
zoom=4:
zoom=3:

zoom=2:
コントリビューションガイド
はじめの一歩
- issue を最後まで読み、次にプロジェクトのコントリビューションガイドを読みます。
- 着手することを issue にコメントします — 二人が同じ作業をするのを防げます。
- リポジトリをフォークし、ブランチを切って変更します。
- issue 番号を参照したプルリクエストを送ります。
調査の方向性
まず、記載されたポリゴン座標を使って提供された Scattermapbox の例を実行し、さまざまなズームレベルでインタラクティブな HTML 出力と生成された PNG を比較します。Scattermapbox の塗りつぶしのレンダリングパスを調査し、報告されているブラウザおよび Plotly のバージョンで結果を確認します。ポリゴンのエッジが、報告されているギザギザのアーティファクトなしに直線としてレンダリングされれば完了です。
索引モデルが issue の本文から書いたものです。
評価
- 技術スタック
- plotly, python
- 領域
- data-visualization
- issue の種類
- バグ
- 難易度
- 4/5
- 見積もり時間
- 3〜5日
- 活発さ
- 停滞
- 明瞭さ
- おおむね明確
- 初心者へのやさしさ
- 35/100