Scattermapbox fill plotting jagged lines
Ninguém assumiu esta issue ainda.
- Linguagem predominante
- Python
- Estrelas
- 18.8k
- Forks
- 2.8k
- Merge médio
- 16h 26min
- PRs com merge (30d)
- 21
Descrição
Issue
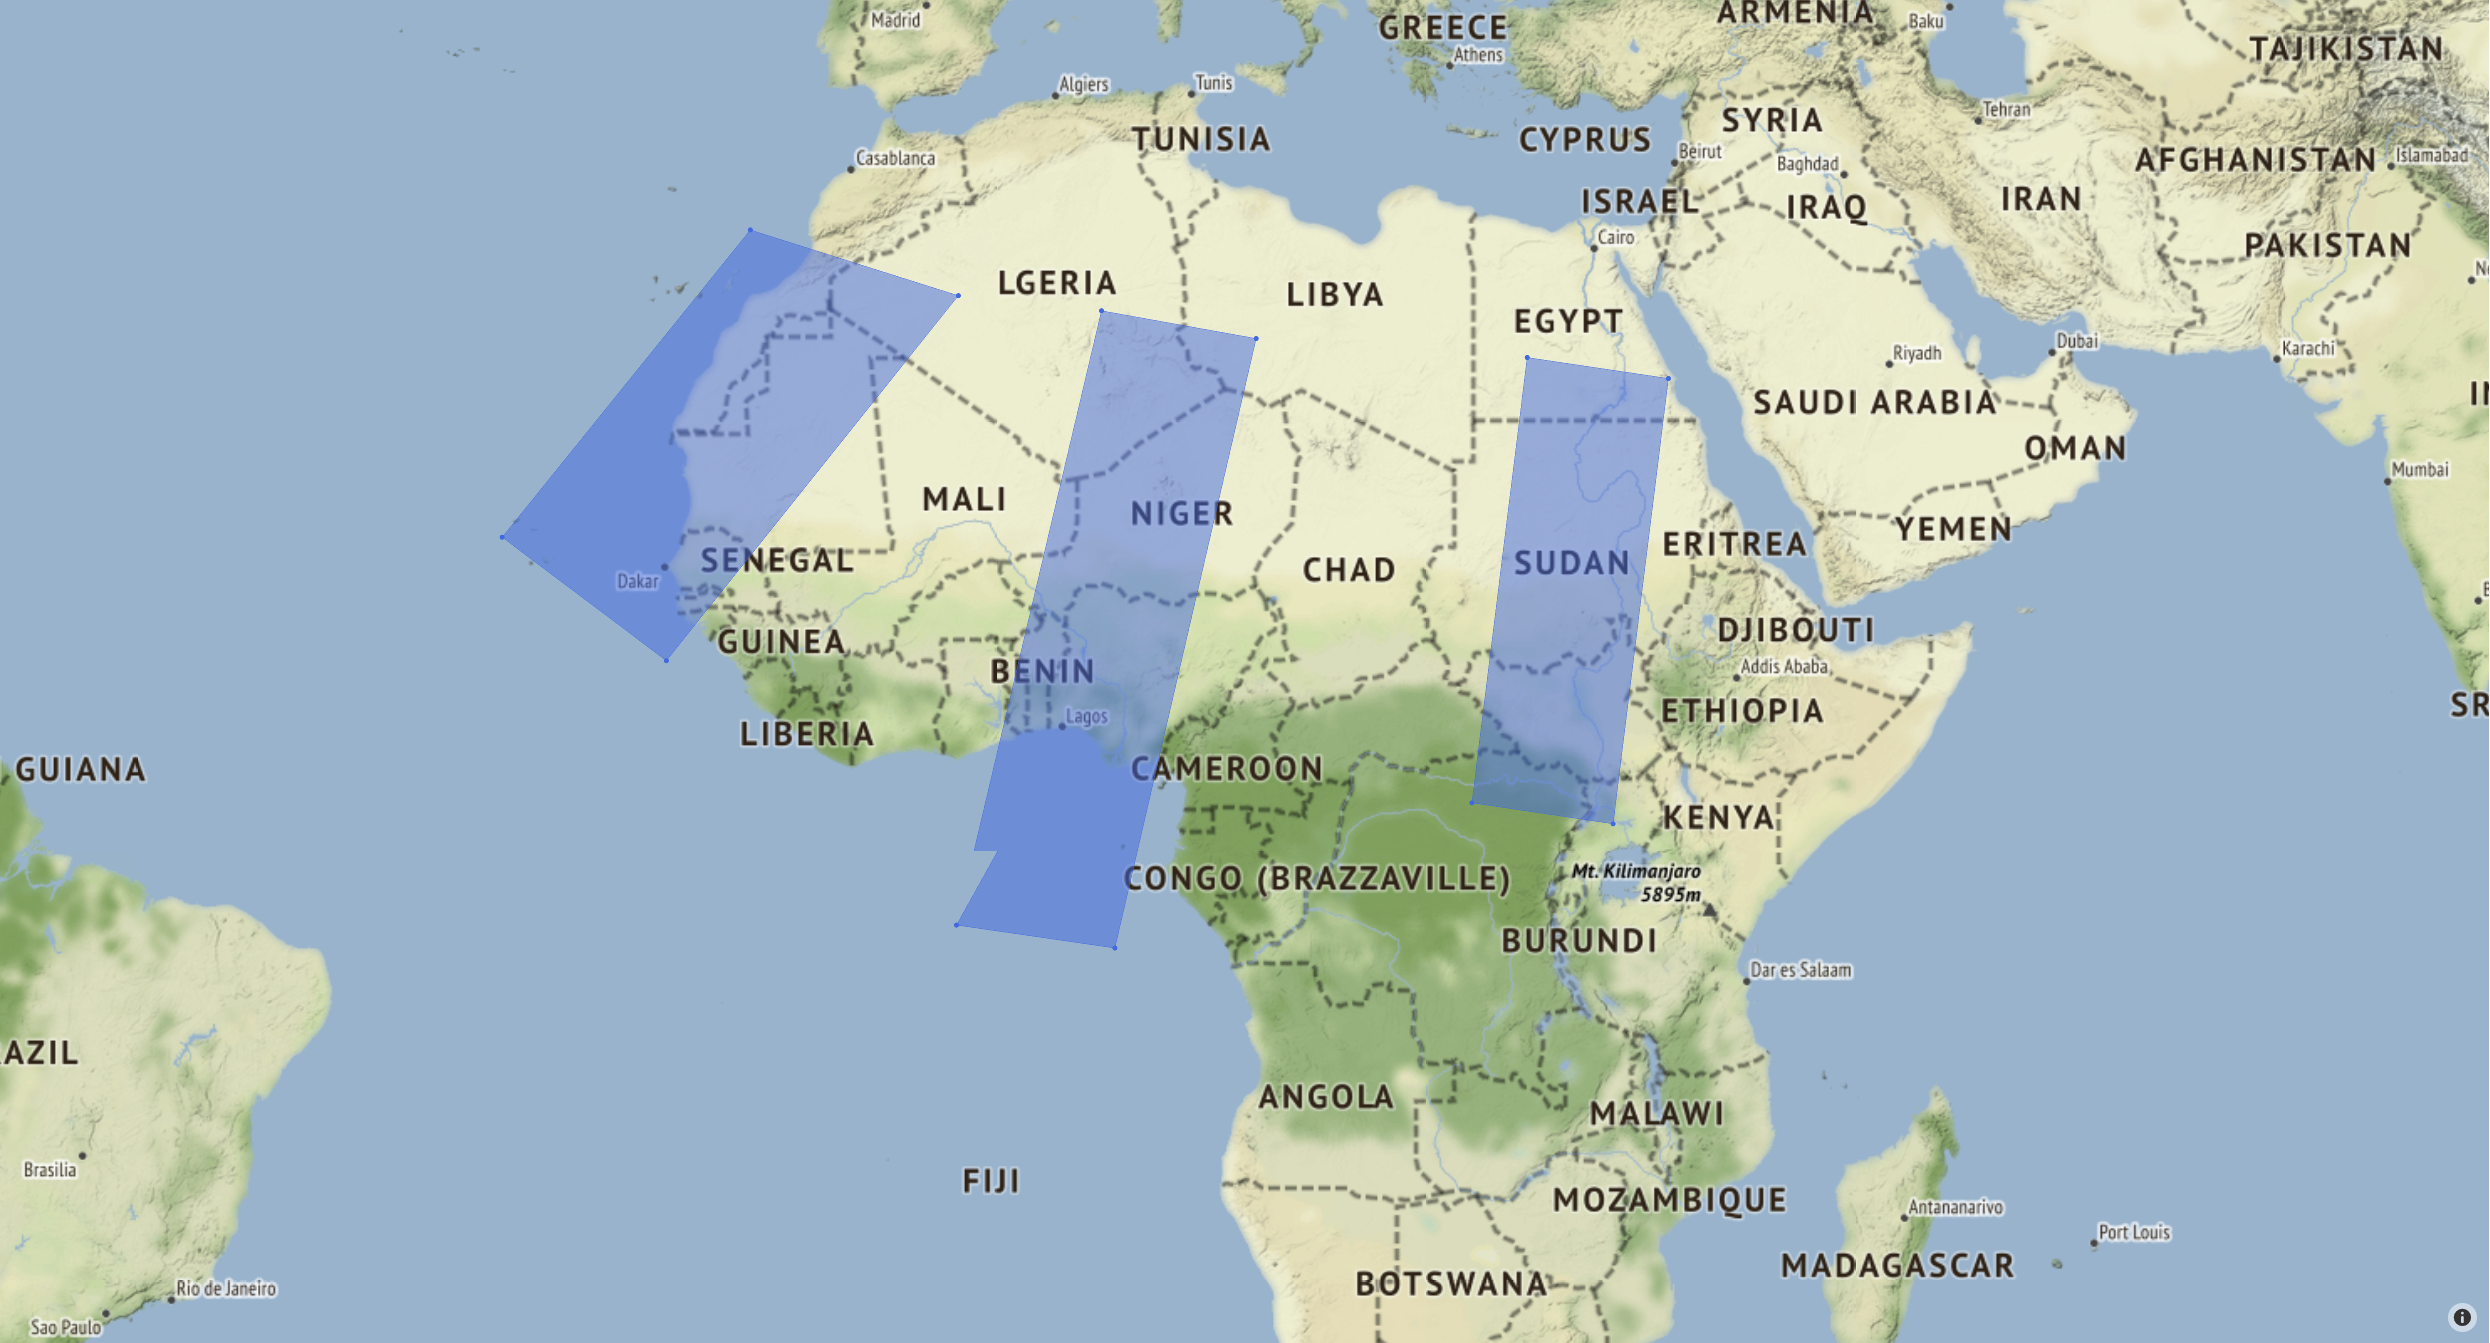
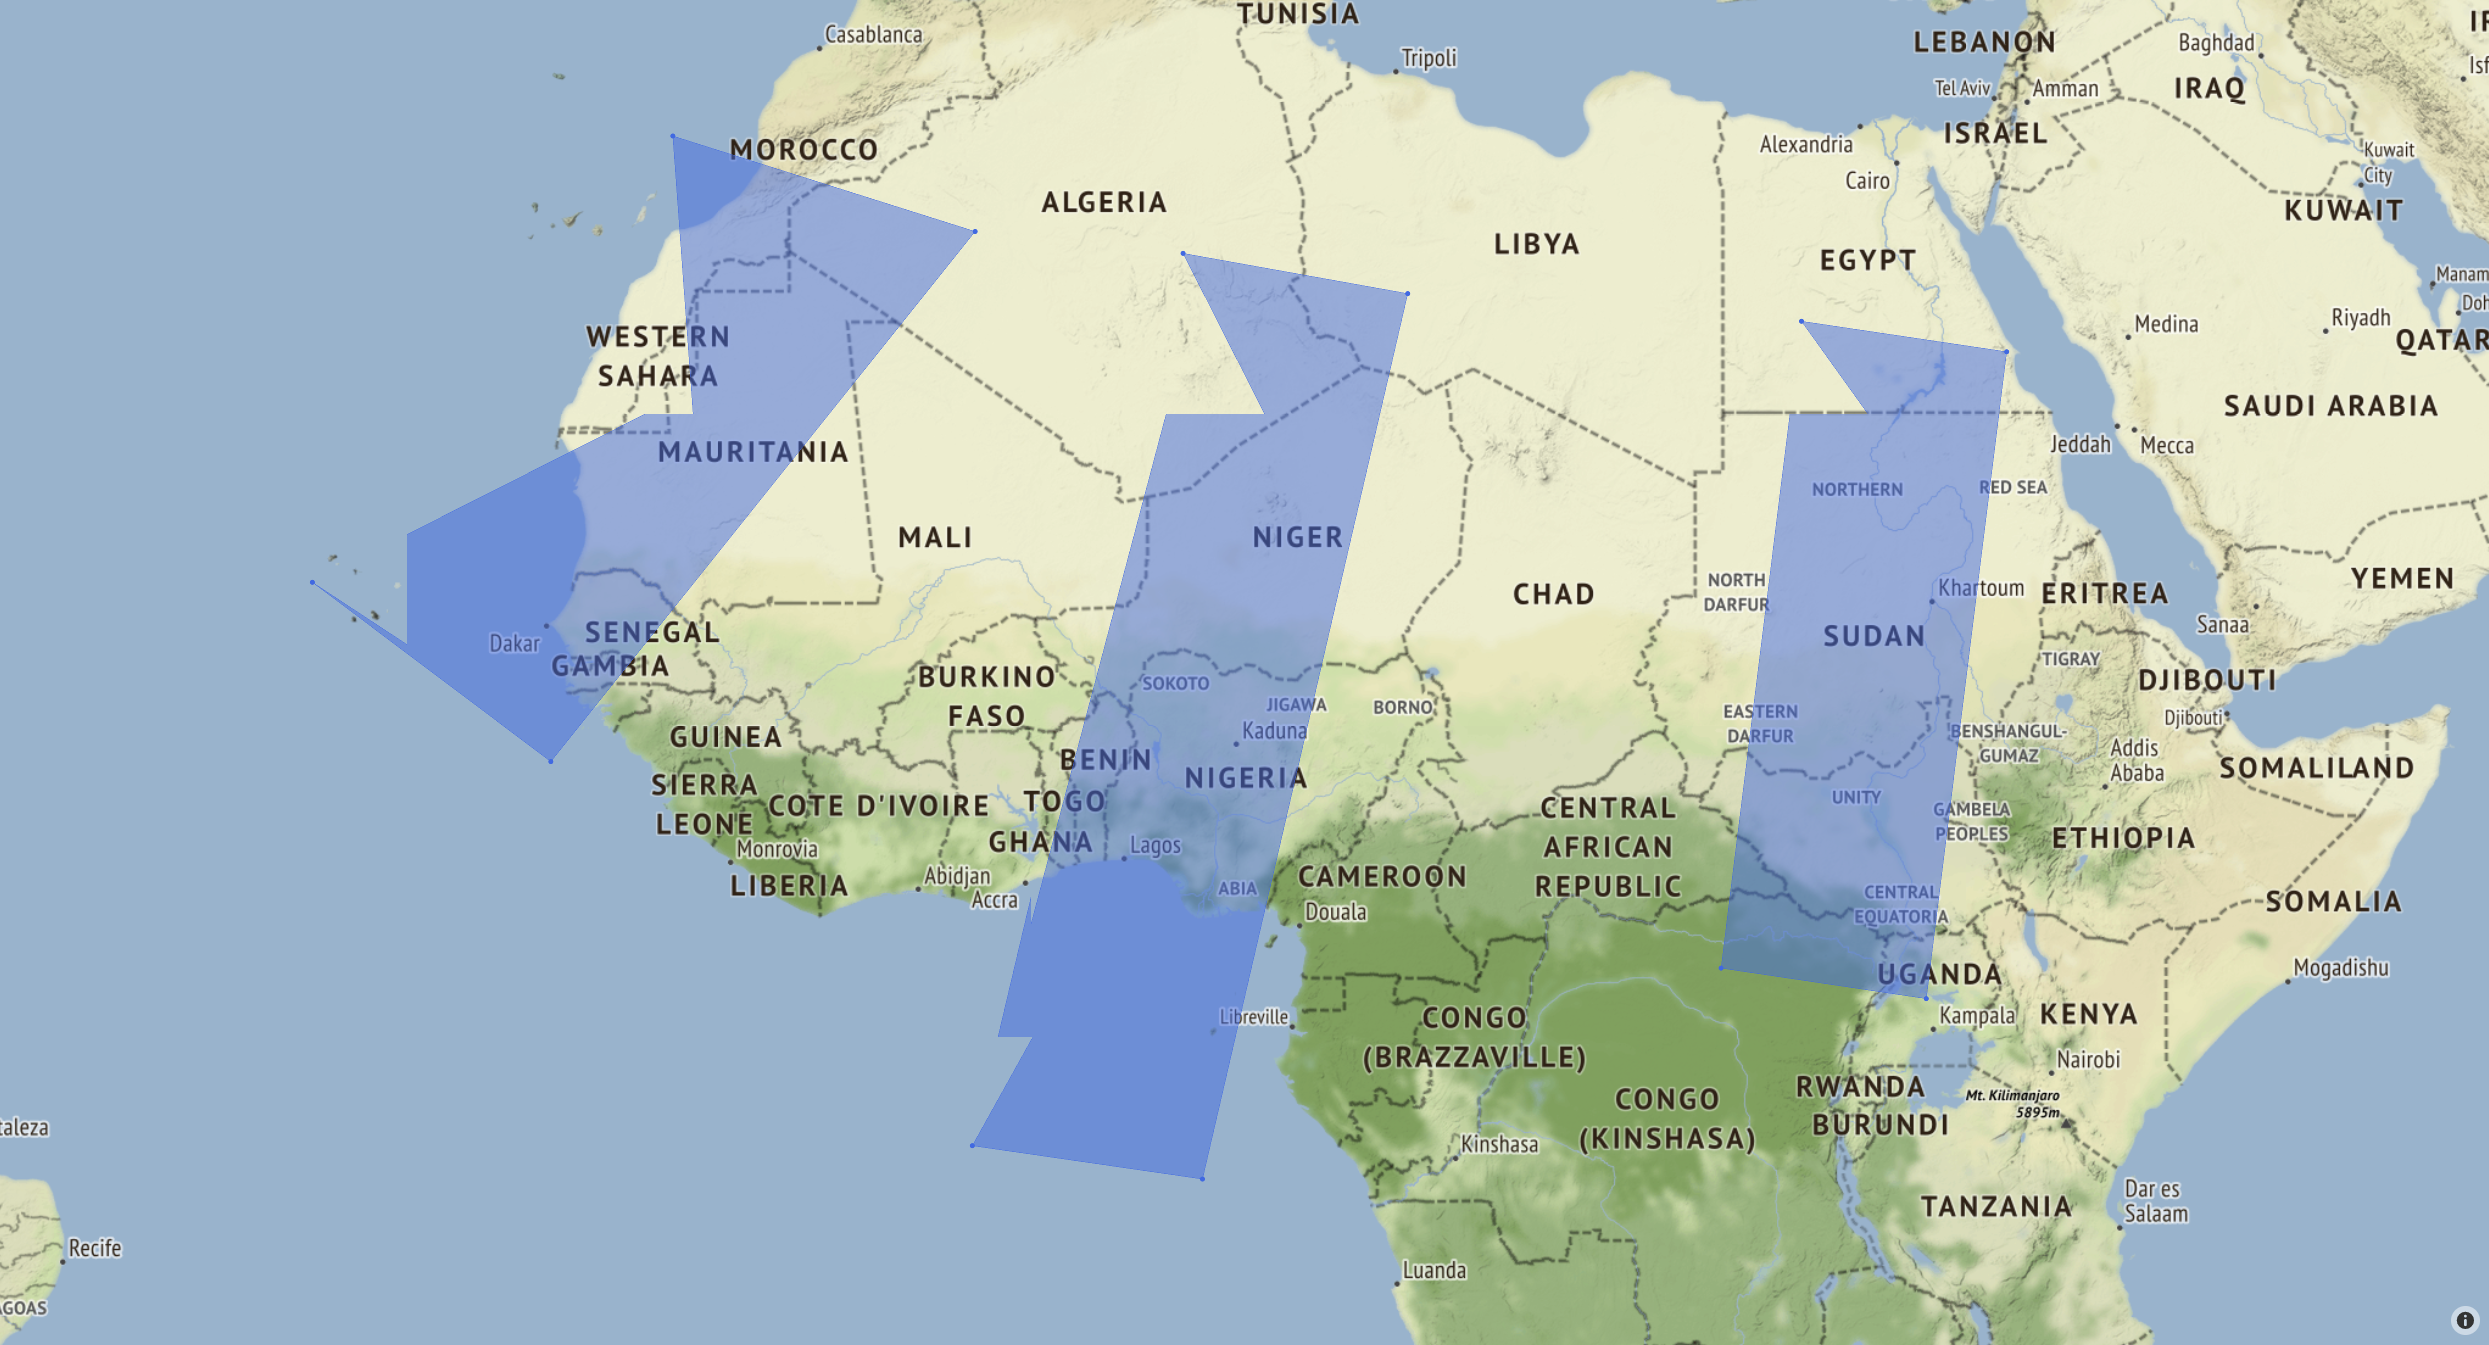
I'm plotting filled polygons on a map using Scattermapbox. It successfully plots the corner markers, but doesn't show a straight line between the two points, seen in the first image. When zooming in on the map, it makes even more jagged lines on all the polygons, seen in the second image.
I tried running the code and opening the .html file on both a windows and linux machine, with the same results.
Specifications
- Windows 10
- Chrome 92.0.4515.131
- python 3.8.11
- plotly 5.1.0
Issue also appears with:
- Ubuntu 18.0.45
- Firefox 91.0 / Edge 91.0.864.64
- python 3.6.9
- plotly 4.14.3
Code to produce the images
import numpy as np
import plotly.graph_objects as go

corners1 = np.array([[5.5, 13.6, 6.2, -2.1], [27.2, 25.9, -5.1, -3.9]])
corners2 = np.array([[-12.9, -2.0, -17.3, -25.9], [30.9, 27.9, 9.9, 16.2]])
corners3 = np.array([[27.8, 35.2, 32.3, 24.9], [25.0, 24.0, 1.4, 2.5]])

sat_corners = [corners1, corners2, corners3]

fig = go.Figure()
for corners in sat_corners:
    fig.add_trace(go.Scattermapbox(
        fill="toself",
        lat=corners[:][1],
        lon=corners[:][0],
        marker={'size': 5, 'color': 'royalblue'}))

fig.update_layout(
    mapbox={
        'style': "stamen-terrain",
        'center': {'lat': 11.547231, 'lon': -5.885243},
        'zoom': 3.5},
    showlegend=False,
    margin_t=20, margin_r=20, margin_b=20, margin_l=20
)

fig.show()
fig.write_html('test_map.html')
fig.write_image('test_map.png', width=1000, height=1000, engine='kaleido')
Resulting Images
These images are screengrabs from Chrome:
Dog leg is visible in the lower left corner of the center polygon.
Here, jagged lines are visible on all polygons. Lines stay like this as far as you can zoom in.
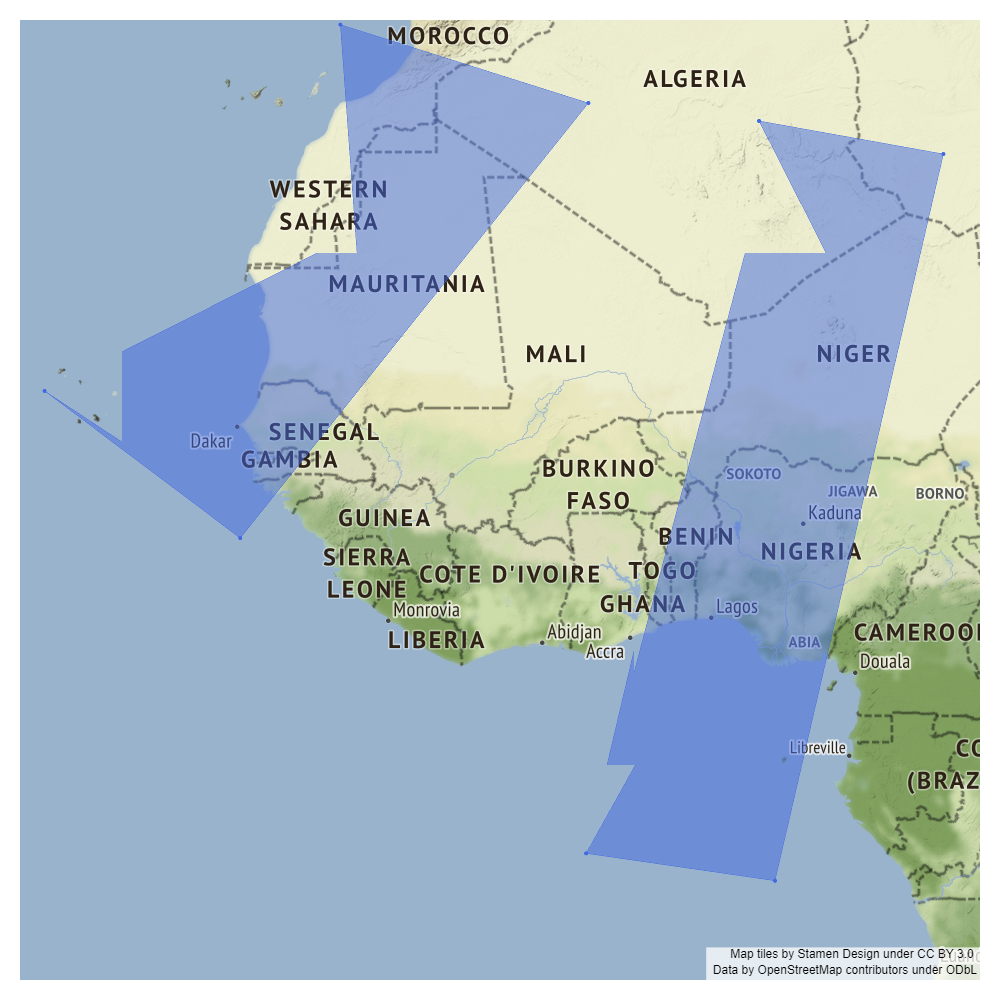
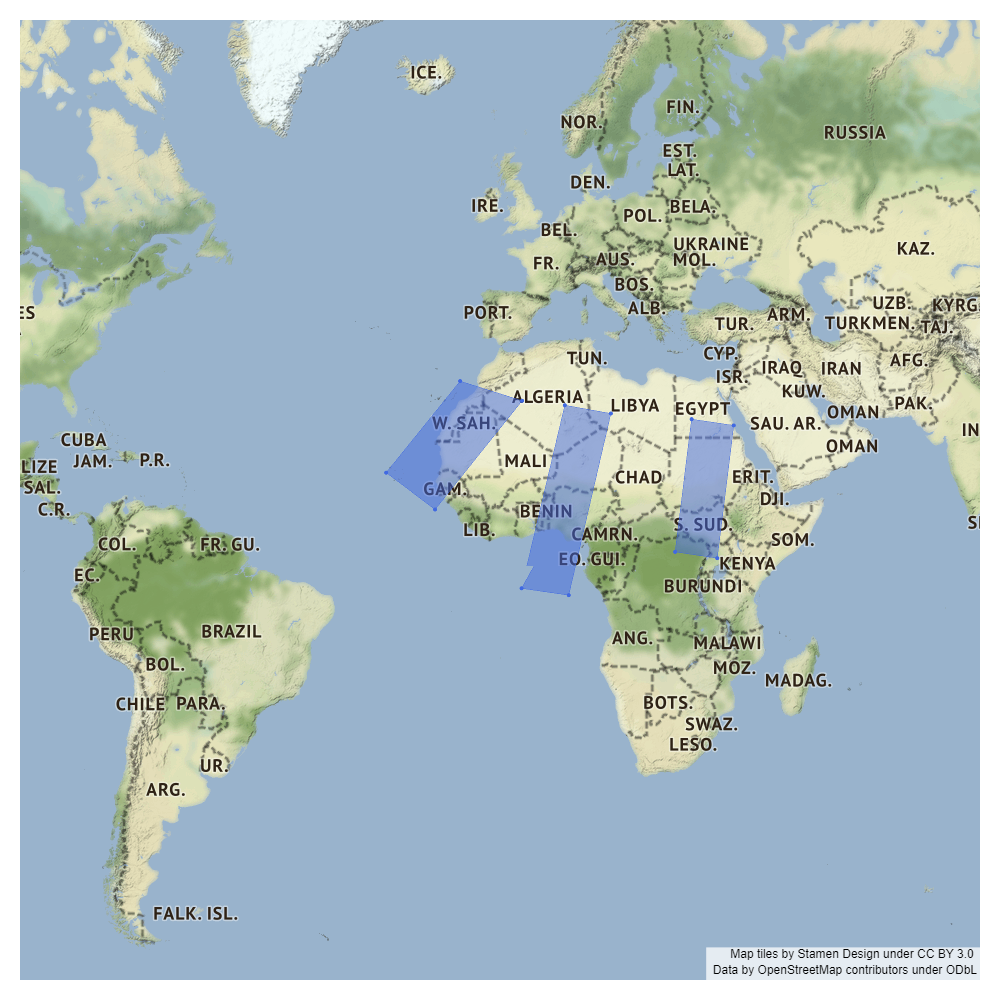
These images are the .png files with different zoom parameters given in fig.update_layout:
zoom=4:
zoom=3:

zoom=2:
Guia de contribuição
Primeiros passos
- Leia a issue inteira e depois o guia de contribuição do projeto.
- Comente na issue dizendo que vai assumir — evita que duas pessoas façam o mesmo trabalho.
- Faça um fork do repositório e trabalhe em uma branch.
- Abra um pull request que referencie o número da issue.
Direção de pesquisa
Comece executando o exemplo de Scattermapbox fornecido com as coordenadas de polígono listadas e compare a saída HTML interativa com o PNG gerado em diferentes níveis de zoom. Investigue o caminho de renderização do preenchimento do Scattermapbox e verifique o resultado nas versões de navegador e Plotly relatadas. Considera-se concluído quando as bordas do polígono forem renderizadas como linhas retas, sem os artefatos serrilhados relatados.
Escrita pelo modelo de indexação a partir do texto da issue.
Avaliação
- Stack de tecnologia
- plotly, python
- Domínio
- data-visualization
- Tipo de issue
- Bug
- Dificuldade
- 4/5
- Tempo estimado
- 3-5 dias
- Status de atividade
- Estagnada
- Clareza
- Razoavelmente clara
- Facilidade para iniciantes
- 35/100