plot_mapbox() causes precision and slowness issues with hover and highlight features
まだ誰も着手していません。
- 主要言語
- R
- スター
- 2.7k
- フォーク
- 641
- PR マージ指標
- 30日以内にマージされた PR はありません
説明
Hi folks, choropleth maps using plotly + simple features + mapbox as base map is the perfect combination in my opinion, it is really beautiful and functional.
However, I have not been able to use it because, when plot_mapbox() is used as opposed to plot_ly(), hover gets very imprecise and the highlight very slow.
Consider this MWE:
devtools::install_github("ipeaGIT/geobr", subdir = "r-package")
library(geobr)
library(sf)
library(plotly)

mapbox_token <- "your mapbox token"
Sys.setenv('MAPBOX_TOKEN'=mapbox_token)

data_sf <- geobr::read_region(year=2010) %>%
    sf::st_cast("MULTIPOLYGON")

plot_mapbox() %>%
  add_sf(
    data = data_sf %>% highlight_key(~name_region),
    split = ~name_region, showlegend = FALSE,
    text = ~paste0(name_region,": ",code_region),
    hoverinfo = "text"
  ) %>%
  highlight(on = "plotly_hover", off = "plotly_doubleclick")
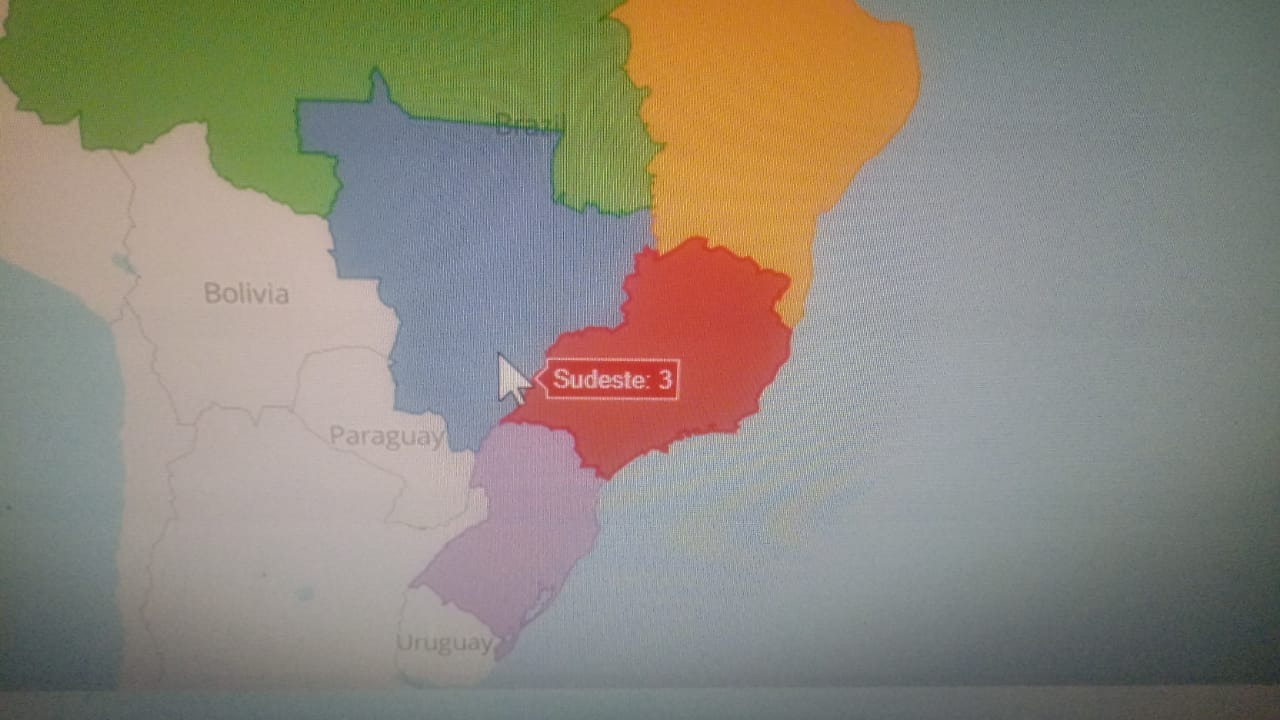
For example, as shown in the picture below, while the mouse is pointing to the blue region, the hover shows the info from the red region.
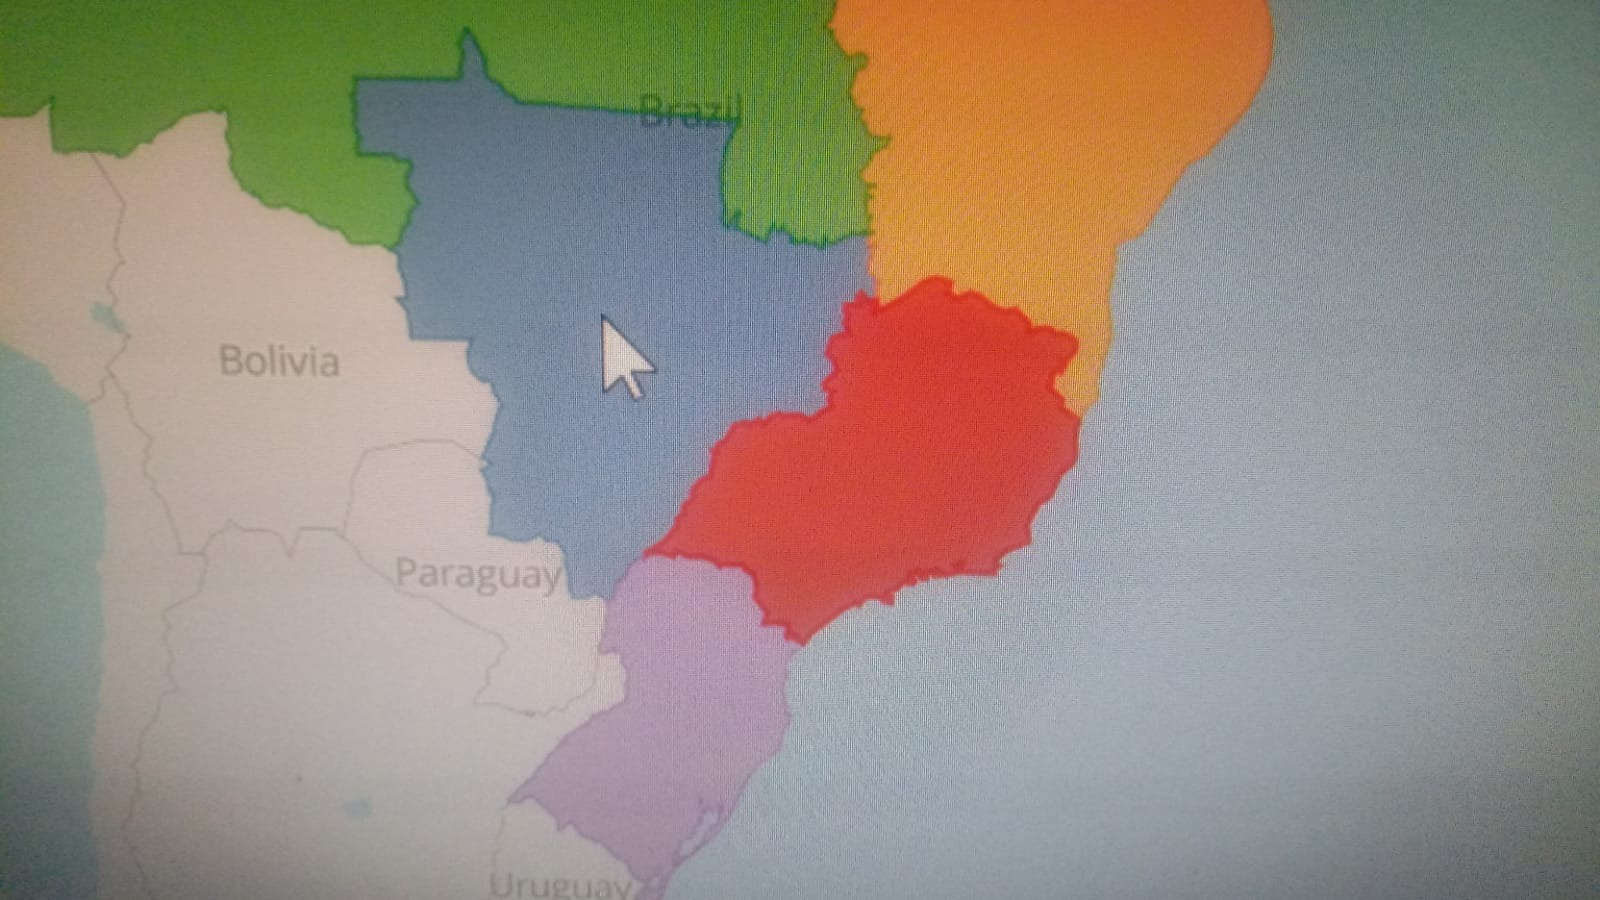
Another example, here the mouse is pointing right in the middle of the blue region but no hover data is shown.
And finally, the highlight_key() is a very valuable feature, nonetheless it is too slow and laggy to be effectively used with plot_mapbox(), at least in my machine, do you have different experiences with it?
R version 4.1.1 (2021-08-10)
Platform: x86_64-w64-mingw32/x64 (64-bit)
Running under: Windows 10 x64 (build 19044)

Matrix products: default

locale:
[1] LC_COLLATE=English_United States.1252
[2] LC_CTYPE=English_United States.1252
[3] LC_MONETARY=English_United States.1252
[4] LC_NUMERIC=C
[5] LC_TIME=English_United States.1252
system code page: 65001

attached base packages:
[1] stats     graphics  grDevices utils
[5] datasets  methods   base

other attached packages:
[1] geobr_1.6.6   sf_1.0-6      plotly_4.10.0
[4] ggplot2_3.3.5
Thank you
コントリビューションガイド
はじめの一歩
- issue を最後まで読み、次にプロジェクトのコントリビューションガイドを読みます。
- 着手することを issue にコメントします — 二人が同じ作業をするのを防げます。
- リポジトリをフォークし、ブランチを切って変更します。
- issue 番号を参照したプルリクエストを送ります。
調査の方向性
まず、提供された MWE を plot_mapbox()、add_sf()、highlight_key()、highlight() とともに実行し、その hover の挙動を plot_ly() と比較します。plot_mapbox の経路と、hover の対象指定とハイライトの相互作用を調査します。対象のマップで hover がポインターの下にある領域を一貫して識別し、ハイライトが応答性よく動作すれば完了です。
索引モデルが issue の本文から書いたものです。
評価
- 技術スタック
- r
- 領域
- data-visualization
- issue の種類
- バグ
- 難易度
- 4/5
- 見積もり時間
- 3〜5日
- 活発さ
- 停滞
- 明瞭さ
- おおむね明確
- 初心者へのやさしさ
- 35/100