plot_mapbox() causes precision and slowness issues with hover and highlight features
Nessuno ha ancora preso questa issue.
- Lingua principale
- R
- Stelle
- 2.7k
- Fork
- 641
- Metriche di merge delle PR
- Nessuna PR unita negli ultimi 30g
Descrizione
Hi folks, choropleth maps using plotly + simple features + mapbox as base map is the perfect combination in my opinion, it is really beautiful and functional.
However, I have not been able to use it because, when plot_mapbox() is used as opposed to plot_ly(), hover gets very imprecise and the highlight very slow.
Consider this MWE:
devtools::install_github("ipeaGIT/geobr", subdir = "r-package")
library(geobr)
library(sf)
library(plotly)

mapbox_token <- "your mapbox token"
Sys.setenv('MAPBOX_TOKEN'=mapbox_token)

data_sf <- geobr::read_region(year=2010) %>%
    sf::st_cast("MULTIPOLYGON")

plot_mapbox() %>%
  add_sf(
    data = data_sf %>% highlight_key(~name_region),
    split = ~name_region, showlegend = FALSE,
    text = ~paste0(name_region,": ",code_region),
    hoverinfo = "text"
  ) %>%
  highlight(on = "plotly_hover", off = "plotly_doubleclick")
For example, as shown in the picture below, while the mouse is pointing to the blue region, the hover shows the info from the red region.
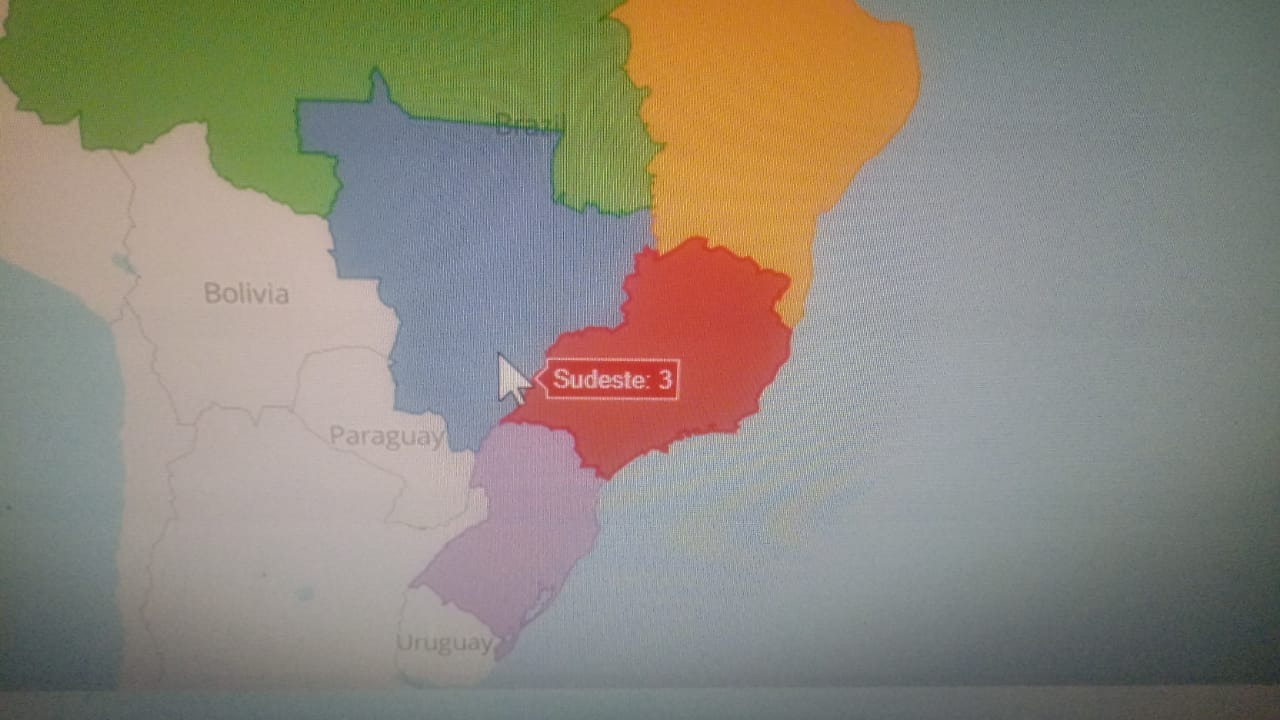
Another example, here the mouse is pointing right in the middle of the blue region but no hover data is shown.
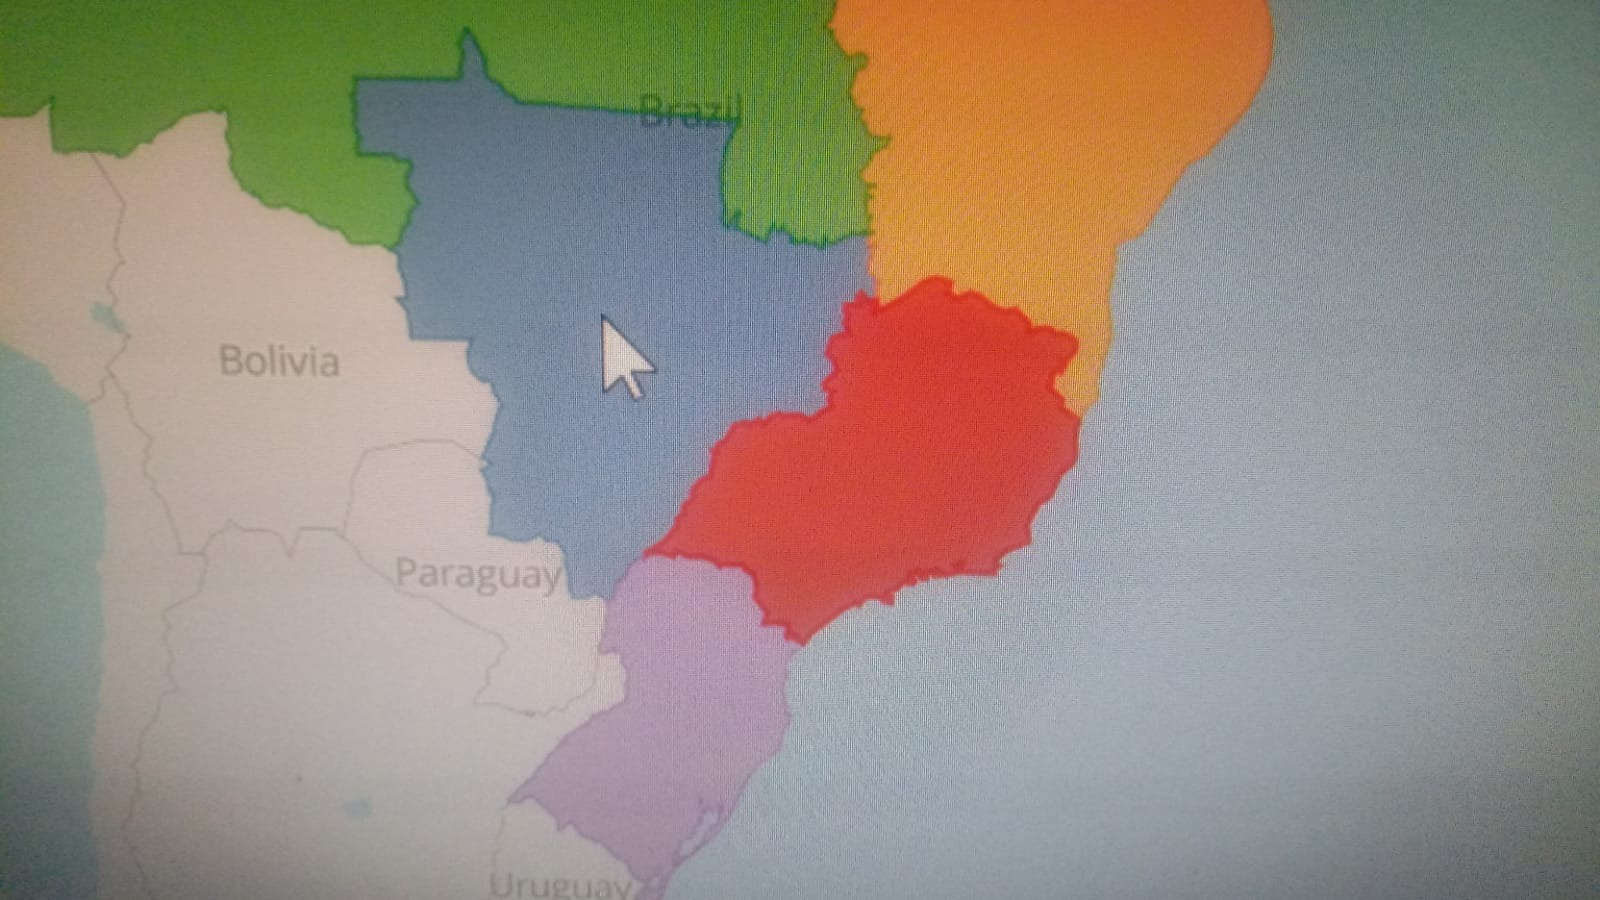
And finally, the highlight_key() is a very valuable feature, nonetheless it is too slow and laggy to be effectively used with plot_mapbox(), at least in my machine, do you have different experiences with it?
R version 4.1.1 (2021-08-10)
Platform: x86_64-w64-mingw32/x64 (64-bit)
Running under: Windows 10 x64 (build 19044)

Matrix products: default

locale:
[1] LC_COLLATE=English_United States.1252
[2] LC_CTYPE=English_United States.1252
[3] LC_MONETARY=English_United States.1252
[4] LC_NUMERIC=C
[5] LC_TIME=English_United States.1252
system code page: 65001

attached base packages:
[1] stats     graphics  grDevices utils
[5] datasets  methods   base

other attached packages:
[1] geobr_1.6.6   sf_1.0-6      plotly_4.10.0
[4] ggplot2_3.3.5
Thank you
Guida per i contributori
Apri la guida per i contributori
Come iniziare
- Leggi tutta la issue e poi la guida ai contributi del progetto.
- Commenta sulla issue per dire che te ne occupi tu — evita che due persone facciano lo stesso lavoro.
- Fai un fork del repository e lavora su un branch.
- Apri una pull request che faccia riferimento al numero della issue.
Direzione di ricerca
Inizia eseguendo l'MWE fornito con plot_mapbox(), add_sf(), highlight_key() e highlight(), quindi confronta il suo comportamento al passaggio del mouse con quello di plot_ly(). Analizza il percorso plot_mapbox e l'interazione tra il target del passaggio del mouse e l'evidenziazione. Il lavoro è completato quando il passaggio del mouse identifica in modo coerente la regione sotto il puntatore e l'evidenziazione risponde correttamente per la mappa mostrata.
Scritto dal modello di indicizzazione a partire dal testo della issue.
Valutazione
- Stack tecnologico
- r
- Ambito
- data-visualization
- Tipo di issue
- Bug
- Difficoltà
- 4/5
- Tempo stimato
- 3-5 giorni
- Stato di attività
- Ferma
- Chiarezza
- Abbastanza chiara
- Idoneità per principianti
- 35/100