plot_mapbox() causes precision and slowness issues with hover and highlight features
Dieses Issue hat noch niemand übernommen.
- Vorherrschende Sprache
- R
- Sterne
- 2.7k
- Forks
- 641
- PR-Merge-Kennzahlen
- Keine gemergten PRs in 30 T.
Beschreibung
Hi folks, choropleth maps using plotly + simple features + mapbox as base map is the perfect combination in my opinion, it is really beautiful and functional.
However, I have not been able to use it because, when plot_mapbox() is used as opposed to plot_ly(), hover gets very imprecise and the highlight very slow.
Consider this MWE:
devtools::install_github("ipeaGIT/geobr", subdir = "r-package")
library(geobr)
library(sf)
library(plotly)

mapbox_token <- "your mapbox token"
Sys.setenv('MAPBOX_TOKEN'=mapbox_token)

data_sf <- geobr::read_region(year=2010) %>%
    sf::st_cast("MULTIPOLYGON")

plot_mapbox() %>%
  add_sf(
    data = data_sf %>% highlight_key(~name_region),
    split = ~name_region, showlegend = FALSE,
    text = ~paste0(name_region,": ",code_region),
    hoverinfo = "text"
  ) %>%
  highlight(on = "plotly_hover", off = "plotly_doubleclick")
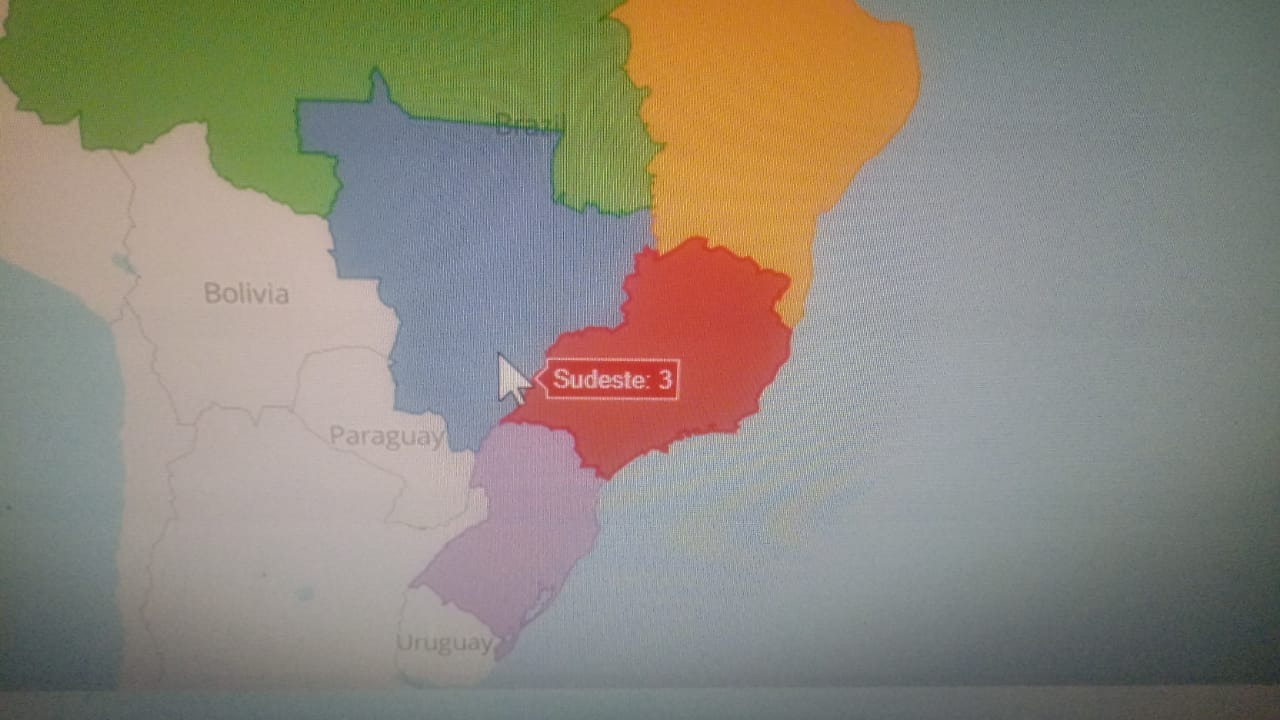
For example, as shown in the picture below, while the mouse is pointing to the blue region, the hover shows the info from the red region.
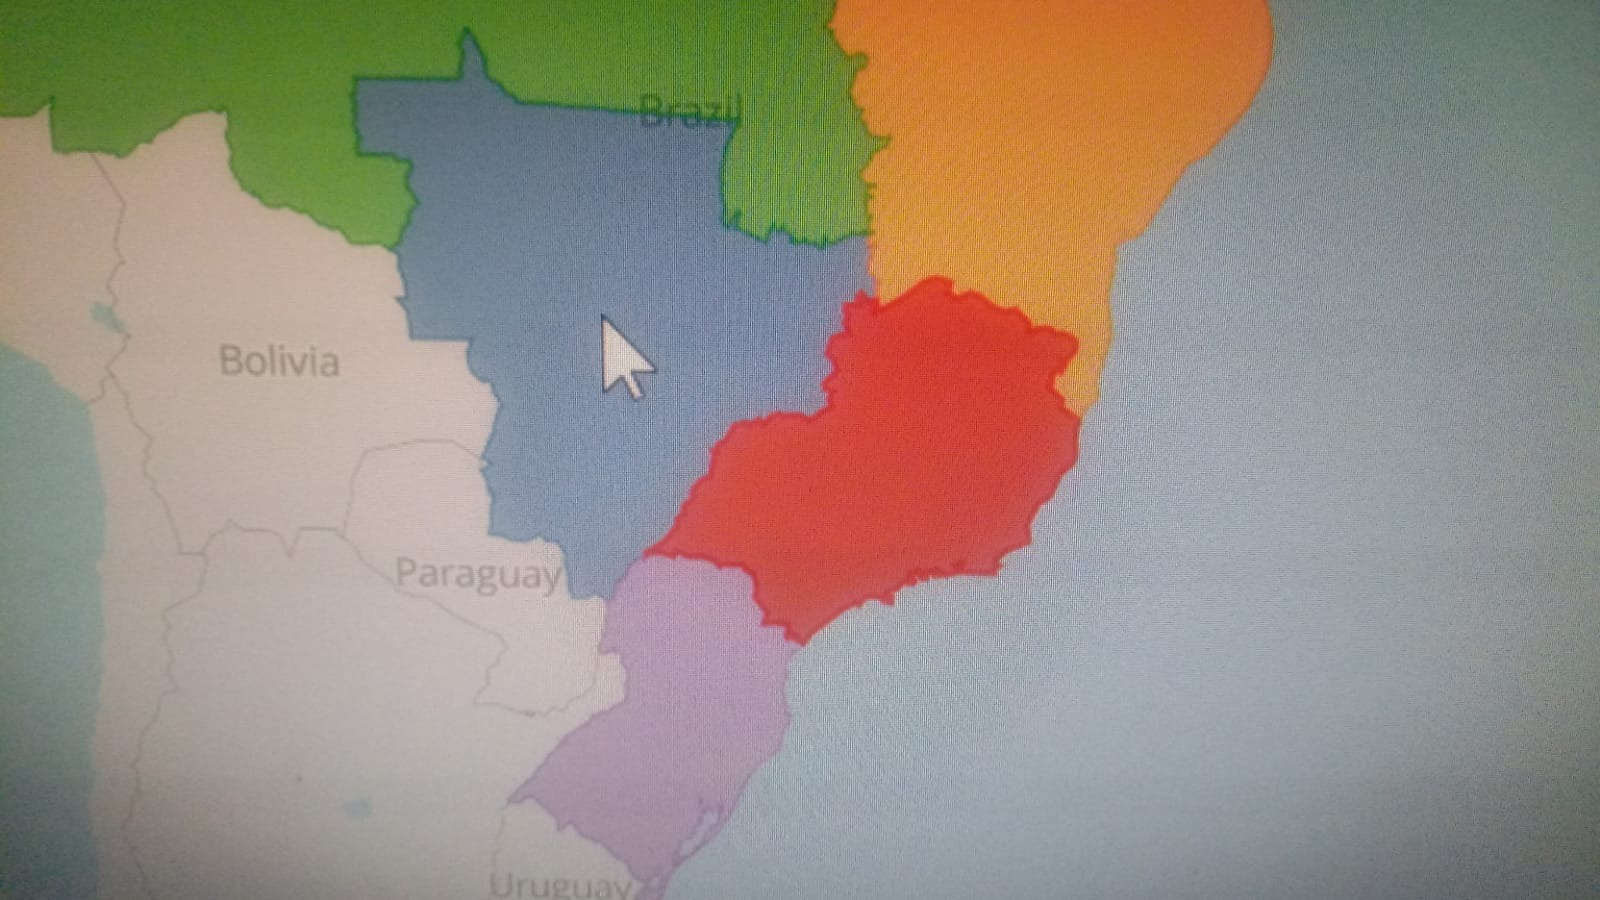
Another example, here the mouse is pointing right in the middle of the blue region but no hover data is shown.
And finally, the highlight_key() is a very valuable feature, nonetheless it is too slow and laggy to be effectively used with plot_mapbox(), at least in my machine, do you have different experiences with it?
R version 4.1.1 (2021-08-10)
Platform: x86_64-w64-mingw32/x64 (64-bit)
Running under: Windows 10 x64 (build 19044)

Matrix products: default

locale:
[1] LC_COLLATE=English_United States.1252
[2] LC_CTYPE=English_United States.1252
[3] LC_MONETARY=English_United States.1252
[4] LC_NUMERIC=C
[5] LC_TIME=English_United States.1252
system code page: 65001

attached base packages:
[1] stats     graphics  grDevices utils
[5] datasets  methods   base

other attached packages:
[1] geobr_1.6.6   sf_1.0-6      plotly_4.10.0
[4] ggplot2_3.3.5
Thank you
Beitragsleitfaden
Erste Schritte
- Lies das ganze Issue und danach den Beitragsleitfaden des Projekts.
- Schreib ins Issue, dass du es übernimmst — das erspart doppelte Arbeit.
- Forke das Repository und arbeite in einem Branch.
- Öffne einen Pull Request, der die Issue-Nummer nennt.
Rechercherichtung
Beginne damit, das bereitgestellte MWE mit plot_mapbox(), add_sf(), highlight_key() und highlight() auszuführen, und vergleiche anschließend dessen Hover-Verhalten mit plot_ly(). Untersuche den plot_mapbox-Pfad und das Zusammenspiel zwischen dem Hover-Ziel und der Hervorhebung. Als erledigt gilt die Aufgabe, wenn der Hover konsistent die Region unter dem Zeiger identifiziert und die Hervorhebung für die demonstrierte Karte reaktionsfähig ist.
Vom Indexierungsmodell aus dem Issue-Text verfasst.
Bewertung
- Tech-Stack
- r
- Bereich
- data-visualization
- Issue-Typ
- Bug
- Schwierigkeit
- 4/5
- Geschätzter Aufwand
- 3-5 Tage
- Aktivitätsstatus
- Veraltet
- Klarheit
- Größtenteils klar
- Anfängerfreundlichkeit
- 35/100