plot_mapbox() causes precision and slowness issues with hover and highlight features
还没有人认领这个 Issue。
- 主要语言
- R
- 星标
- 2.7k
- 派生
- 641
- PR 合并指标
- 30 天内没有已合并 PR
描述
Hi folks, choropleth maps using plotly + simple features + mapbox as base map is the perfect combination in my opinion, it is really beautiful and functional.
However, I have not been able to use it because, when plot_mapbox() is used as opposed to plot_ly(), hover gets very imprecise and the highlight very slow.
Consider this MWE:
devtools::install_github("ipeaGIT/geobr", subdir = "r-package")
library(geobr)
library(sf)
library(plotly)

mapbox_token <- "your mapbox token"
Sys.setenv('MAPBOX_TOKEN'=mapbox_token)

data_sf <- geobr::read_region(year=2010) %>%
    sf::st_cast("MULTIPOLYGON")

plot_mapbox() %>%
  add_sf(
    data = data_sf %>% highlight_key(~name_region),
    split = ~name_region, showlegend = FALSE,
    text = ~paste0(name_region,": ",code_region),
    hoverinfo = "text"
  ) %>%
  highlight(on = "plotly_hover", off = "plotly_doubleclick")
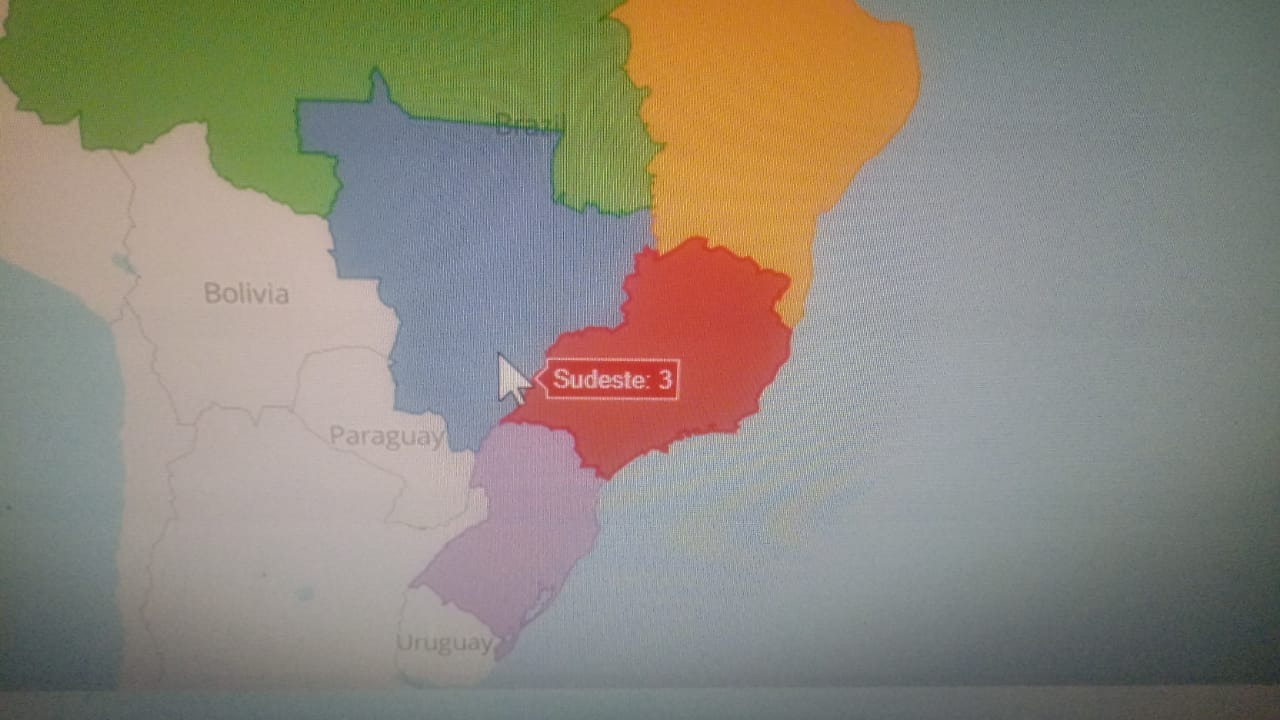
For example, as shown in the picture below, while the mouse is pointing to the blue region, the hover shows the info from the red region.
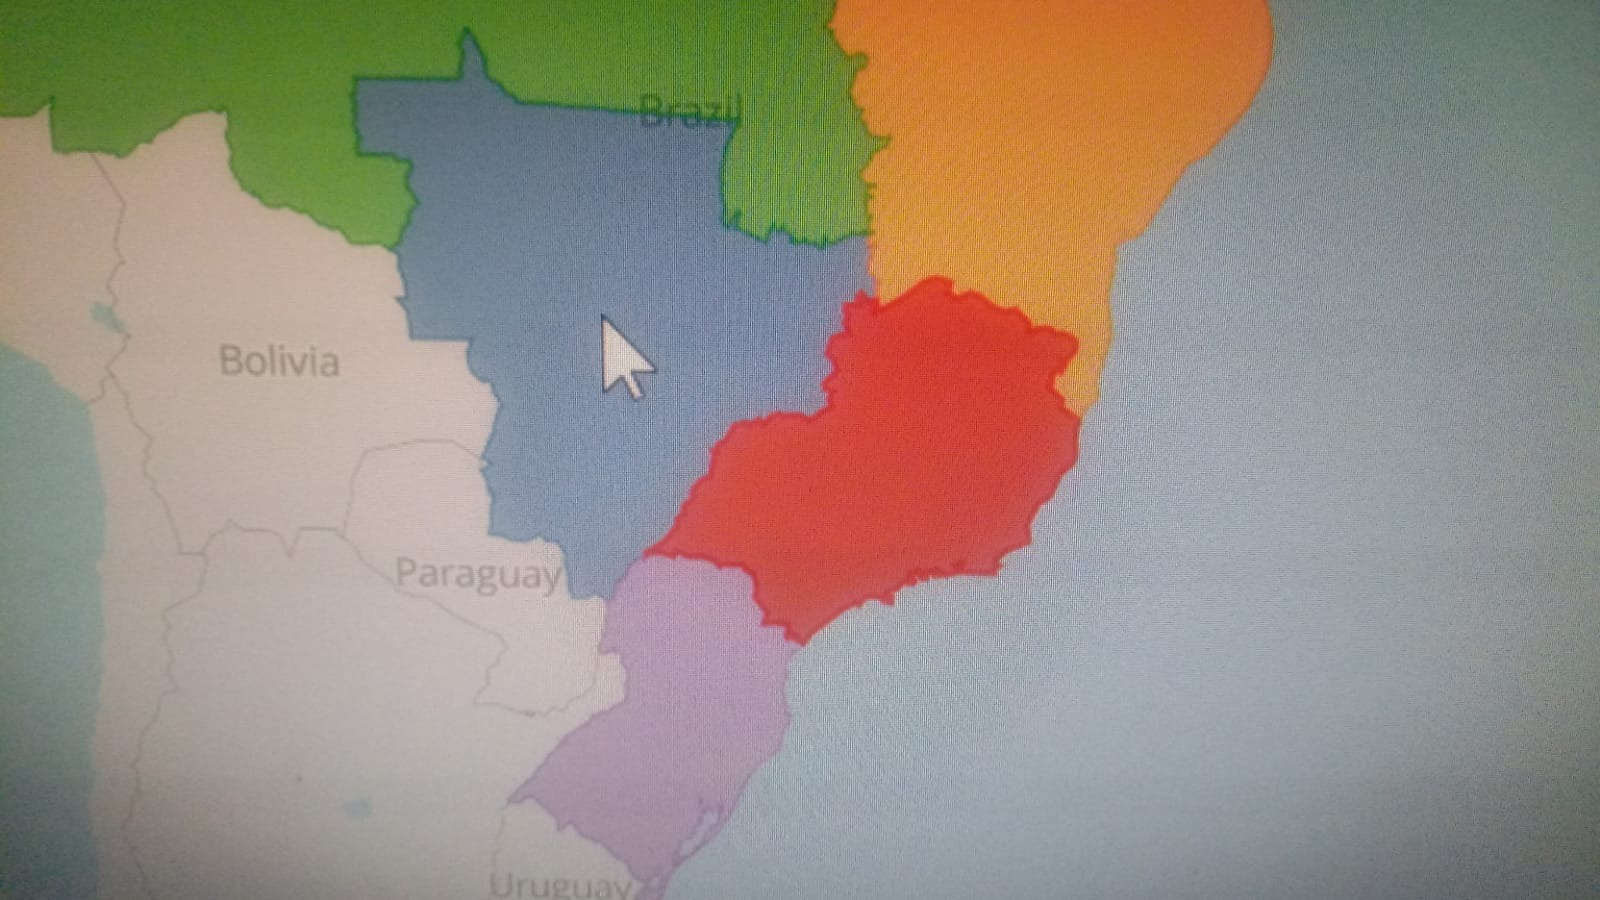
Another example, here the mouse is pointing right in the middle of the blue region but no hover data is shown.
And finally, the highlight_key() is a very valuable feature, nonetheless it is too slow and laggy to be effectively used with plot_mapbox(), at least in my machine, do you have different experiences with it?
R version 4.1.1 (2021-08-10)
Platform: x86_64-w64-mingw32/x64 (64-bit)
Running under: Windows 10 x64 (build 19044)

Matrix products: default

locale:
[1] LC_COLLATE=English_United States.1252
[2] LC_CTYPE=English_United States.1252
[3] LC_MONETARY=English_United States.1252
[4] LC_NUMERIC=C
[5] LC_TIME=English_United States.1252
system code page: 65001

attached base packages:
[1] stats     graphics  grDevices utils
[5] datasets  methods   base

other attached packages:
[1] geobr_1.6.6   sf_1.0-6      plotly_4.10.0
[4] ggplot2_3.3.5
Thank you
贡献指南
从这里开始
- 先读完整个 Issue,再读项目的贡献指南。
- 在 Issue 下留言说明你要接手 —— 这能避免两个人做同样的事。
- Fork 仓库,在一个分支上完成修改。
- 提交 Pull Request,并在描述里引用这个 Issue 编号。
调研方向
首先运行提供的 MWE,使用 plot_mapbox()、add_sf()、highlight_key() 和 highlight(),然后将其 hover 行为与 plot_ly() 进行比较。调查 plot_mapbox 路径,以及 hover 目标定位与高亮之间的交互。当 hover 能够始终识别指针下方的区域,并且高亮在所示地图上响应灵敏时,即视为完成。
由索引模型根据 Issue 内容生成。
评估
- 技术栈
- r
- 领域
- data-visualization
- Issue 类型
- 缺陷
- 难度
- 4/5
- 预计耗时
- 3-5 天
- 活跃度
- 停滞
- 描述清晰度
- 基本清楚
- 新手友好度
- 35/100