plot_mapbox() causes precision and slowness issues with hover and highlight features
Nobody has claimed this yet.
- Dominant language
- R
- Stars
- 2.7k
- Forks
- 641
- PR merge metrics
- No merged PRs in 30d
Description
Hi folks, choropleth maps using plotly + simple features + mapbox as base map is the perfect combination in my opinion, it is really beautiful and functional.
However, I have not been able to use it because, when plot_mapbox() is used as opposed to plot_ly(), hover gets very imprecise and the highlight very slow.
Consider this MWE:
devtools::install_github("ipeaGIT/geobr", subdir = "r-package")
library(geobr)
library(sf)
library(plotly)

mapbox_token <- "your mapbox token"
Sys.setenv('MAPBOX_TOKEN'=mapbox_token)

data_sf <- geobr::read_region(year=2010) %>%
    sf::st_cast("MULTIPOLYGON")

plot_mapbox() %>%
  add_sf(
    data = data_sf %>% highlight_key(~name_region),
    split = ~name_region, showlegend = FALSE,
    text = ~paste0(name_region,": ",code_region),
    hoverinfo = "text"
  ) %>%
  highlight(on = "plotly_hover", off = "plotly_doubleclick")
For example, as shown in the picture below, while the mouse is pointing to the blue region, the hover shows the info from the red region.
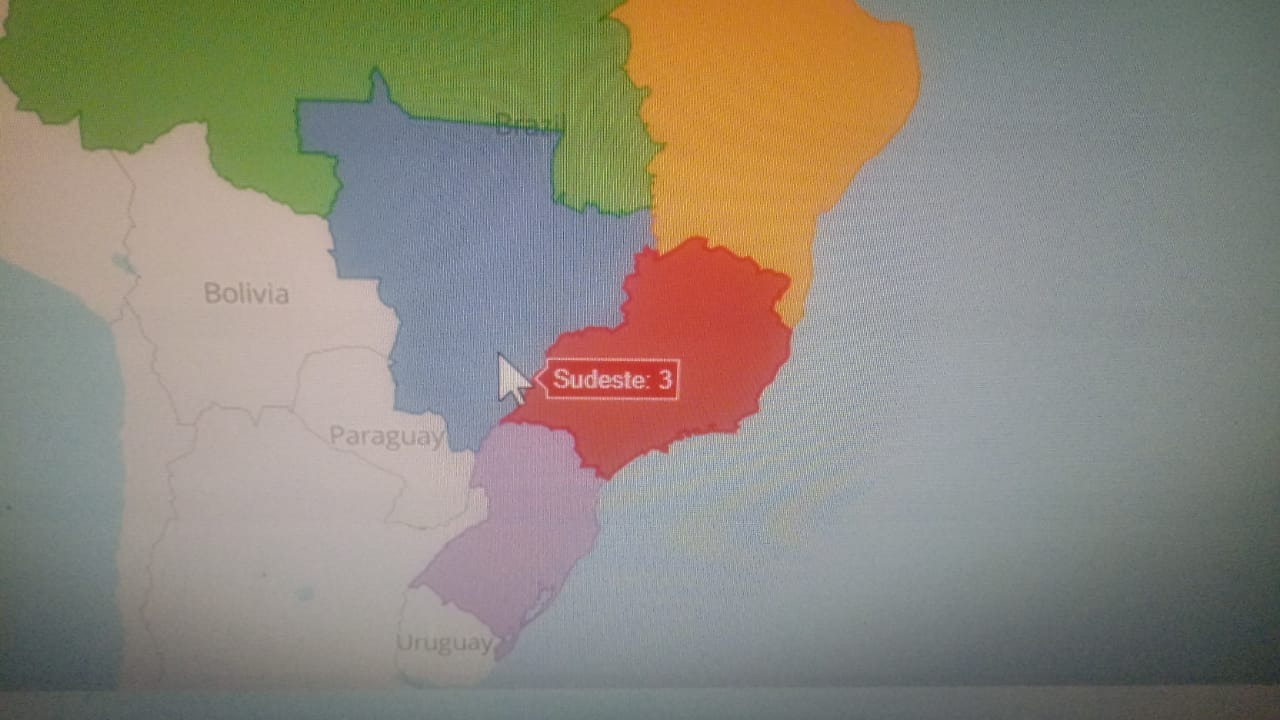
Another example, here the mouse is pointing right in the middle of the blue region but no hover data is shown.
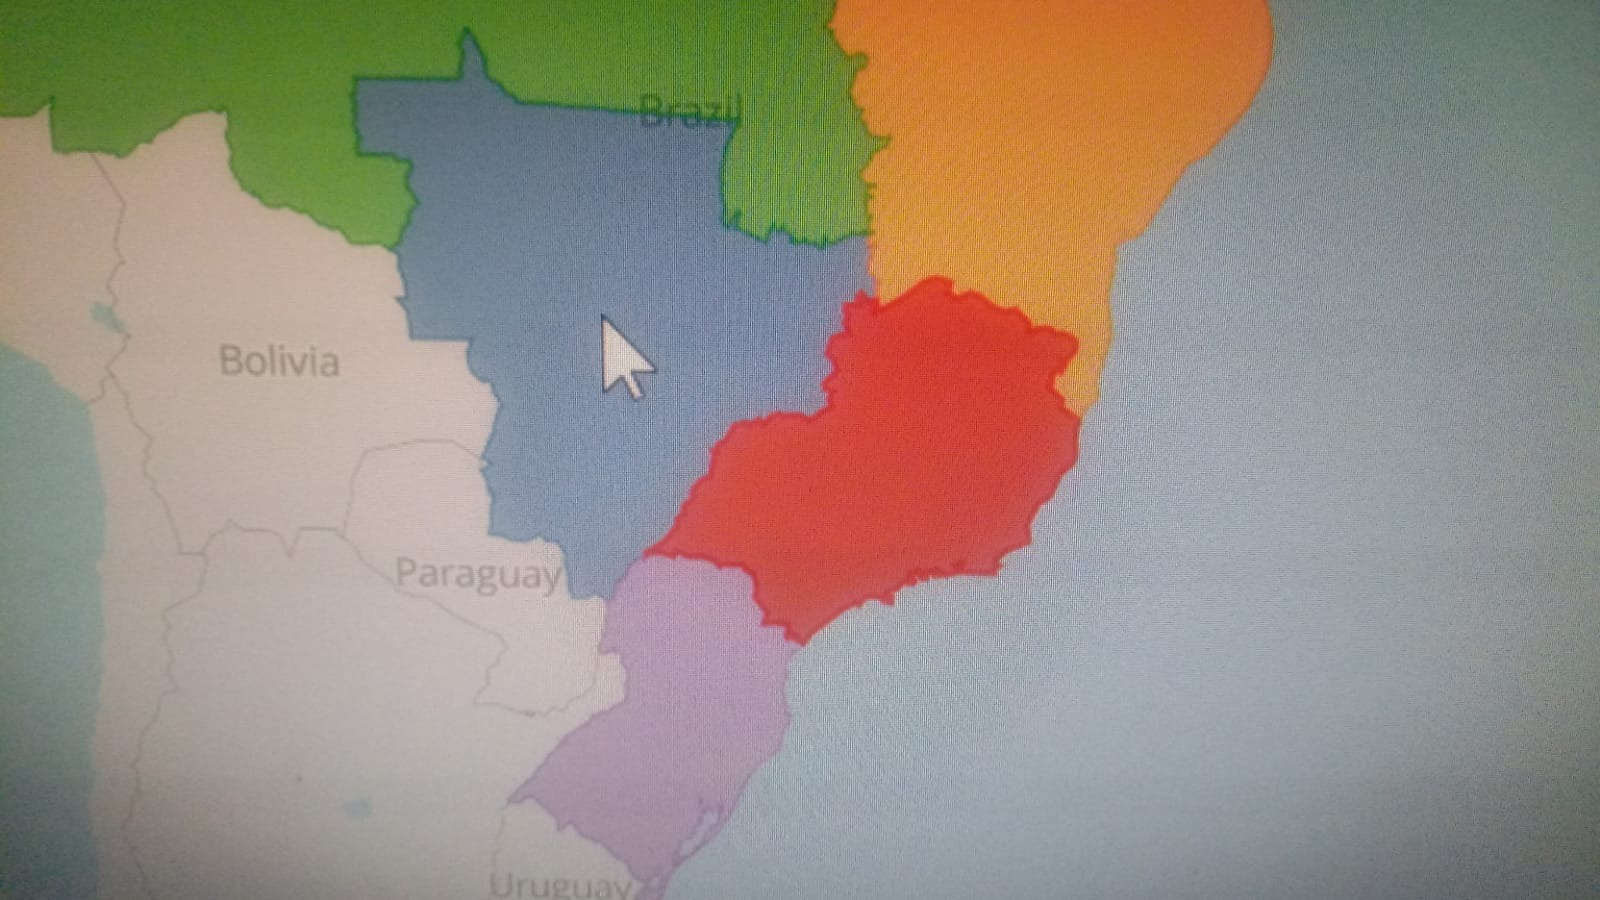
And finally, the highlight_key() is a very valuable feature, nonetheless it is too slow and laggy to be effectively used with plot_mapbox(), at least in my machine, do you have different experiences with it?
R version 4.1.1 (2021-08-10)
Platform: x86_64-w64-mingw32/x64 (64-bit)
Running under: Windows 10 x64 (build 19044)

Matrix products: default

locale:
[1] LC_COLLATE=English_United States.1252
[2] LC_CTYPE=English_United States.1252
[3] LC_MONETARY=English_United States.1252
[4] LC_NUMERIC=C
[5] LC_TIME=English_United States.1252
system code page: 65001

attached base packages:
[1] stats     graphics  grDevices utils
[5] datasets  methods   base

other attached packages:
[1] geobr_1.6.6   sf_1.0-6      plotly_4.10.0
[4] ggplot2_3.3.5
Thank you
Contributor guide
First steps
- Read the whole issue, then the project's contributing guide.
- Comment on the issue to say you are picking it up — it saves two people doing the same work.
- Fork the repository and make your change on a branch.
- Open a pull request that references the issue number.
Research direction
Start by running the supplied MWE with plot_mapbox(), add_sf(), highlight_key(), and highlight(), then compare its hover behavior with plot_ly(). Investigate the plot_mapbox path and the interaction between hover targeting and highlighting. Done means hover consistently identifies the region under the pointer and highlighting is responsive for the demonstrated map.
Written by the indexing model from the issue text.
Assessment
- Tech stack
- r
- Domain
- data-visualization
- Issue type
- Bug
- Difficulty
- 4/5
- Estimated time
- 3-5 days
- Activity status
- Stale
- Clarity
- Mostly clear
- Newbie friendliness
- 35/100