Is there a way to fix bar height of horizontal bar charts in R Plotly?
Chưa có ai nhận issue này.
- Ngôn ngữ chính
- R
- Star
- 2.7k
- Fork
- 641
- Chỉ số merge pull request
- Không có pull request nào được merge trong 30 ngày
Mô tả
Not too sure if this question is asked before. I have been trying to look for solutions but to no avail.
I am trying to create a shiny dashboard with plotly. The thing is that I have earmarked a fixed space for the chart. And in this chart, it is a horizontal bar charts for many category.
Here is the minimally reproducible code.
library(tidyverse)
library(plotly)

tibble(Category = str_c("Category ", seq(1, 20, 1)),
       Value = runif(20)) %>%
  plot_ly(
    y = ~ Category,
    x = ~ Value,
    type = "bar",
    hoverinfo = "text",
    hovertemplate = ~paste0(
      "Category: ", Category, "<br>",
      "Value: ", Value,
      "<extra></extra>"
    ),
    marker = list(
      line = list(color = "#000000",
                  width = 1)
    )
  ) %>%
  layout(
    autosize = FALSE,
    showlegend = FALSE,
    xaxis = list(
      title = "Value"
    ),
    yaxis = list(
      title = ""
    )
  )
The issue is that sometimes the number of categories varies. It can be 20 in this case, it can go up to 100.
What I would like to have is to fix the height of the horizontal bar regardless of the number of categories. So if there are more categories, the height of each bar will stay constant and the vertical scroll will appear to accommodate the extra bars.
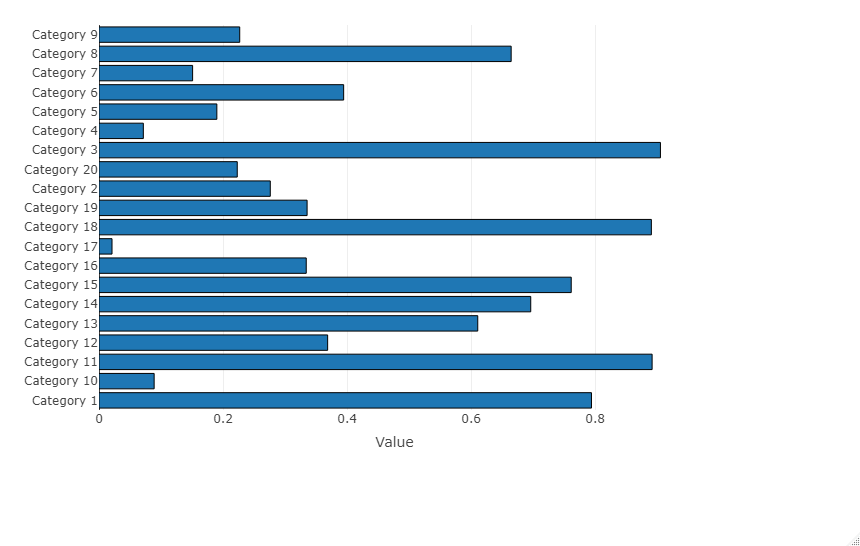
So far the solution prescribed online is to write a fixed formula for height and let Plotly auto-size itself. I took the cue from this site.
https://community.plotly.com/t/how-to-add-vertical-scroll-bar-on-horizontal-bar-chart/12342/2
The work-around suggests writing a formula on height based on the fixed formula
plot_height <- 500 + 10*nrow(df)
But this is not ideal. Sometimes I have only 1 category and the bar height is excessive. Sometimes I have 1000 categories and each of them looks like a stick.
I don't know. I thought having a fixed bar height for horizontal bar charts should be something quite fundamental, but it turns out exceedingly hard in Plotly.
Would appreciate any suggestions here.
Hướng dẫn đóng góp
Bắt đầu từ đâu
- Đọc hết issue, rồi đọc hướng dẫn đóng góp của dự án.
- Bình luận trên issue rằng bạn sẽ nhận — tránh hai người làm cùng một việc.
- Fork repository và làm thay đổi trên một nhánh.
- Mở pull request có tham chiếu số hiệu của issue.
Hướng nghiên cứu
Bắt đầu với ví dụ R có thể tái hiện, đặc biệt là các điểm vào plot_ly() và layout(), đồng thời xem xét giải pháp thay thế của cộng đồng Plotly được liên kết. Xác định xem Plotly có hỗ trợ kích thước thanh ngang cố định kèm cuộn mà không cần tính chiều cao biểu đồ hay không. Được xem là hoàn tất khi có một phương pháp được ghi nhận hoặc triển khai, duy trì chiều cao thanh nhất quán với số lượng danh mục khác nhau.
Do mô hình lập chỉ mục viết ra từ nội dung của issue.
Đánh giá
- Công nghệ
- plotly, r
- Lĩnh vực
- data-visualization
- Loại issue
- Tính năng
- Độ khó
- 5/5
- Thời gian dự kiến
- Hơn một tuần
- Mức độ hoạt động
- Đình trệ
- Độ rõ ràng
- Khá rõ ràng
- Mức phù hợp với người mới
- 35/100