Is there a way to fix bar height of horizontal bar charts in R Plotly?
还没有人认领这个 Issue。
- 主要语言
- R
- 星标
- 2.7k
- 派生
- 641
- PR 合并指标
- 30 天内没有已合并 PR
描述
Not too sure if this question is asked before. I have been trying to look for solutions but to no avail.
I am trying to create a shiny dashboard with plotly. The thing is that I have earmarked a fixed space for the chart. And in this chart, it is a horizontal bar charts for many category.
Here is the minimally reproducible code.
library(tidyverse)
library(plotly)

tibble(Category = str_c("Category ", seq(1, 20, 1)),
       Value = runif(20)) %>%
  plot_ly(
    y = ~ Category,
    x = ~ Value,
    type = "bar",
    hoverinfo = "text",
    hovertemplate = ~paste0(
      "Category: ", Category, "<br>",
      "Value: ", Value,
      "<extra></extra>"
    ),
    marker = list(
      line = list(color = "#000000",
                  width = 1)
    )
  ) %>%
  layout(
    autosize = FALSE,
    showlegend = FALSE,
    xaxis = list(
      title = "Value"
    ),
    yaxis = list(
      title = ""
    )
  )
The issue is that sometimes the number of categories varies. It can be 20 in this case, it can go up to 100.
What I would like to have is to fix the height of the horizontal bar regardless of the number of categories. So if there are more categories, the height of each bar will stay constant and the vertical scroll will appear to accommodate the extra bars.
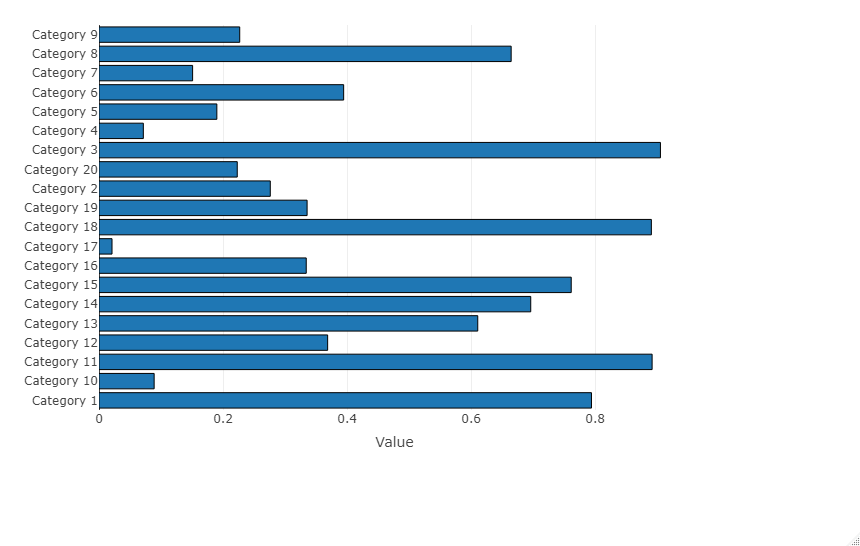
So far the solution prescribed online is to write a fixed formula for height and let Plotly auto-size itself. I took the cue from this site.
https://community.plotly.com/t/how-to-add-vertical-scroll-bar-on-horizontal-bar-chart/12342/2
The work-around suggests writing a formula on height based on the fixed formula
plot_height <- 500 + 10*nrow(df)
But this is not ideal. Sometimes I have only 1 category and the bar height is excessive. Sometimes I have 1000 categories and each of them looks like a stick.
I don't know. I thought having a fixed bar height for horizontal bar charts should be something quite fundamental, but it turns out exceedingly hard in Plotly.
Would appreciate any suggestions here.
贡献指南
从这里开始
- 先读完整个 Issue,再读项目的贡献指南。
- 在 Issue 下留言说明你要接手 —— 这能避免两个人做同样的事。
- Fork 仓库,在一个分支上完成修改。
- 提交 Pull Request,并在描述里引用这个 Issue 编号。
调研方向
从可复现的 R 示例开始,尤其检查 plot_ly() 和 layout() 入口点,并审查链接的 Plotly 社区变通方案。确定 Plotly 是否支持在不计算图表高度的情况下实现固定的水平条形尺寸和滚动。完成的标准是拥有一种已记录或已实现的方法,使条形高度在类别数量变化时保持一致。
由索引模型根据 Issue 内容生成。
评估
- 技术栈
- plotly, r
- 领域
- data-visualization
- Issue 类型
- 功能
- 难度
- 5/5
- 预计耗时
- 一周以上
- 活跃度
- 停滞
- 描述清晰度
- 基本清楚
- 新手友好度
- 35/100