Is there a way to fix bar height of horizontal bar charts in R Plotly?
Nadie ha tomado este issue todavía.
- Lenguaje dominante
- R
- Estrellas
- 2.7k
- Forks
- 641
- Métricas de merge de PR
- Sin PR fusionados en 30 d
Descripción
Not too sure if this question is asked before. I have been trying to look for solutions but to no avail.
I am trying to create a shiny dashboard with plotly. The thing is that I have earmarked a fixed space for the chart. And in this chart, it is a horizontal bar charts for many category.
Here is the minimally reproducible code.
library(tidyverse)
library(plotly)

tibble(Category = str_c("Category ", seq(1, 20, 1)),
       Value = runif(20)) %>%
  plot_ly(
    y = ~ Category,
    x = ~ Value,
    type = "bar",
    hoverinfo = "text",
    hovertemplate = ~paste0(
      "Category: ", Category, "<br>",
      "Value: ", Value,
      "<extra></extra>"
    ),
    marker = list(
      line = list(color = "#000000",
                  width = 1)
    )
  ) %>%
  layout(
    autosize = FALSE,
    showlegend = FALSE,
    xaxis = list(
      title = "Value"
    ),
    yaxis = list(
      title = ""
    )
  )
The issue is that sometimes the number of categories varies. It can be 20 in this case, it can go up to 100.
What I would like to have is to fix the height of the horizontal bar regardless of the number of categories. So if there are more categories, the height of each bar will stay constant and the vertical scroll will appear to accommodate the extra bars.
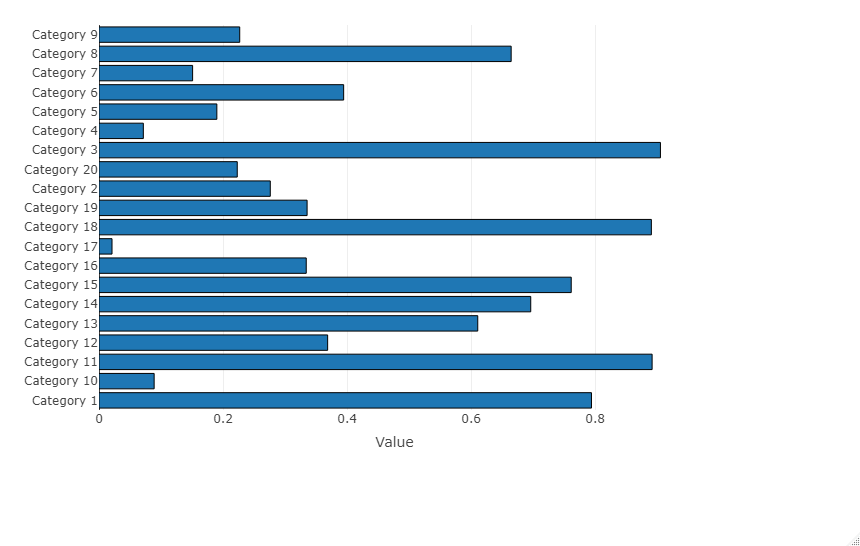
So far the solution prescribed online is to write a fixed formula for height and let Plotly auto-size itself. I took the cue from this site.
https://community.plotly.com/t/how-to-add-vertical-scroll-bar-on-horizontal-bar-chart/12342/2
The work-around suggests writing a formula on height based on the fixed formula
plot_height <- 500 + 10*nrow(df)
But this is not ideal. Sometimes I have only 1 category and the bar height is excessive. Sometimes I have 1000 categories and each of them looks like a stick.
I don't know. I thought having a fixed bar height for horizontal bar charts should be something quite fundamental, but it turns out exceedingly hard in Plotly.
Would appreciate any suggestions here.
Guía de contribución
Primeros pasos
- Lee el issue completo y luego la guía de contribución del proyecto.
- Comenta en el issue que vas a ocuparte — evita que dos personas hagan lo mismo.
- Haz un fork del repositorio y trabaja en una rama.
- Abre un pull request que haga referencia al número del issue.
Línea de trabajo
Comience con el ejemplo reproducible de R, especialmente con los puntos de entrada plot_ly() y layout(), y revise la solución alternativa de la comunidad de Plotly enlazada. Determine si Plotly admite un tamaño fijo para las barras horizontales con desplazamiento sin calcular la altura del gráfico. Se considera terminado cuando existe un enfoque documentado o implementado que mantenga constante la altura de las barras para distintos números de categorías.
Escrito por el modelo de indexación a partir del texto del issue.
Evaluación
- Stack tecnológico
- plotly, r
- Área
- data-visualization
- Tipo de issue
- Nueva funcionalidad
- Dificultad
- 5/5
- Tiempo estimado
- Más de una semana
- Estado de actividad
- Estancado
- Claridad
- Bastante claro
- Aptitud para principiantes
- 35/100