Is there a way to fix bar height of horizontal bar charts in R Plotly?
Personne n'a encore pris cette issue.
- Langage dominant
- R
- Étoiles
- 2.7k
- Forks
- 641
- Métriques de merge des PR
- Aucune PR mergée en 30 j
Description
Not too sure if this question is asked before. I have been trying to look for solutions but to no avail.
I am trying to create a shiny dashboard with plotly. The thing is that I have earmarked a fixed space for the chart. And in this chart, it is a horizontal bar charts for many category.
Here is the minimally reproducible code.
library(tidyverse)
library(plotly)

tibble(Category = str_c("Category ", seq(1, 20, 1)),
       Value = runif(20)) %>%
  plot_ly(
    y = ~ Category,
    x = ~ Value,
    type = "bar",
    hoverinfo = "text",
    hovertemplate = ~paste0(
      "Category: ", Category, "<br>",
      "Value: ", Value,
      "<extra></extra>"
    ),
    marker = list(
      line = list(color = "#000000",
                  width = 1)
    )
  ) %>%
  layout(
    autosize = FALSE,
    showlegend = FALSE,
    xaxis = list(
      title = "Value"
    ),
    yaxis = list(
      title = ""
    )
  )
The issue is that sometimes the number of categories varies. It can be 20 in this case, it can go up to 100.
What I would like to have is to fix the height of the horizontal bar regardless of the number of categories. So if there are more categories, the height of each bar will stay constant and the vertical scroll will appear to accommodate the extra bars.
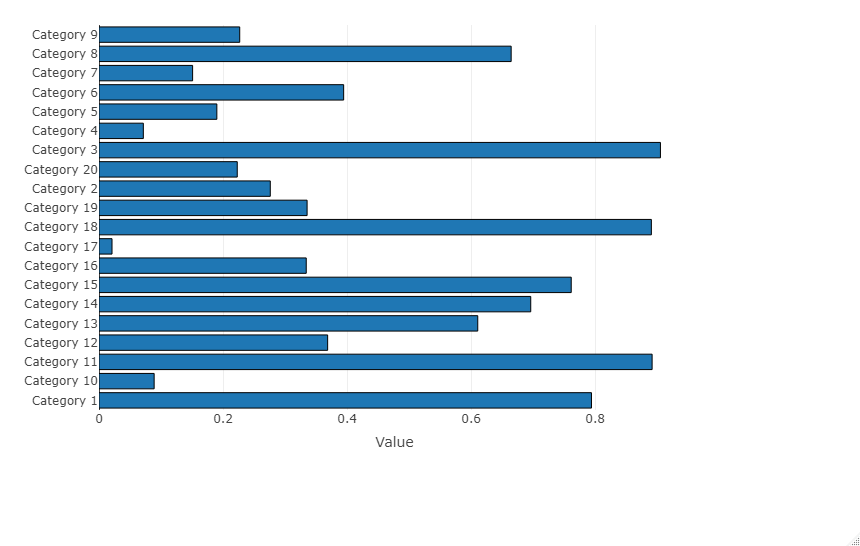
So far the solution prescribed online is to write a fixed formula for height and let Plotly auto-size itself. I took the cue from this site.
https://community.plotly.com/t/how-to-add-vertical-scroll-bar-on-horizontal-bar-chart/12342/2
The work-around suggests writing a formula on height based on the fixed formula
plot_height <- 500 + 10*nrow(df)
But this is not ideal. Sometimes I have only 1 category and the bar height is excessive. Sometimes I have 1000 categories and each of them looks like a stick.
I don't know. I thought having a fixed bar height for horizontal bar charts should be something quite fundamental, but it turns out exceedingly hard in Plotly.
Would appreciate any suggestions here.
Guide de contribution
Ouvrir le guide de contribution
Par où commencer
- Lisez l'issue en entier, puis le guide de contribution du projet.
- Signalez en commentaire que vous la prenez — cela évite que deux personnes fassent le même travail.
- Forkez le dépôt et travaillez sur une branche.
- Ouvrez une pull request qui référence le numéro de l'issue.
Piste de recherche
Commencez par l’exemple R reproductible, en particulier les points d’entrée plot_ly() et layout(), et examinez la solution de contournement de la communauté Plotly indiquée. Déterminez si Plotly prend en charge une taille fixe des barres horizontales avec défilement sans calculer la hauteur du graphique. Le travail est considéré comme terminé lorsqu’une approche documentée ou implémentée maintient une hauteur de barre cohérente pour un nombre variable de catégories.
Rédigé par le modèle d'indexation à partir du texte de l'issue.
Évaluation
- Stack technique
- plotly, r
- Domaine
- data-visualization
- Type d'issue
- Fonctionnalité
- Difficulté
- 5/5
- Temps estimé
- Plus d'une semaine
- Activité
- À l'abandon
- Clarté
- Plutôt claire
- Accessibilité débutants
- 35/100