Is there a way to fix bar height of horizontal bar charts in R Plotly?
まだ誰も着手していません。
- 主要言語
- R
- スター
- 2.7k
- フォーク
- 641
- PR マージ指標
- 30日以内にマージされた PR はありません
説明
Not too sure if this question is asked before. I have been trying to look for solutions but to no avail.
I am trying to create a shiny dashboard with plotly. The thing is that I have earmarked a fixed space for the chart. And in this chart, it is a horizontal bar charts for many category.
Here is the minimally reproducible code.
library(tidyverse)
library(plotly)

tibble(Category = str_c("Category ", seq(1, 20, 1)),
       Value = runif(20)) %>%
  plot_ly(
    y = ~ Category,
    x = ~ Value,
    type = "bar",
    hoverinfo = "text",
    hovertemplate = ~paste0(
      "Category: ", Category, "<br>",
      "Value: ", Value,
      "<extra></extra>"
    ),
    marker = list(
      line = list(color = "#000000",
                  width = 1)
    )
  ) %>%
  layout(
    autosize = FALSE,
    showlegend = FALSE,
    xaxis = list(
      title = "Value"
    ),
    yaxis = list(
      title = ""
    )
  )
The issue is that sometimes the number of categories varies. It can be 20 in this case, it can go up to 100.
What I would like to have is to fix the height of the horizontal bar regardless of the number of categories. So if there are more categories, the height of each bar will stay constant and the vertical scroll will appear to accommodate the extra bars.
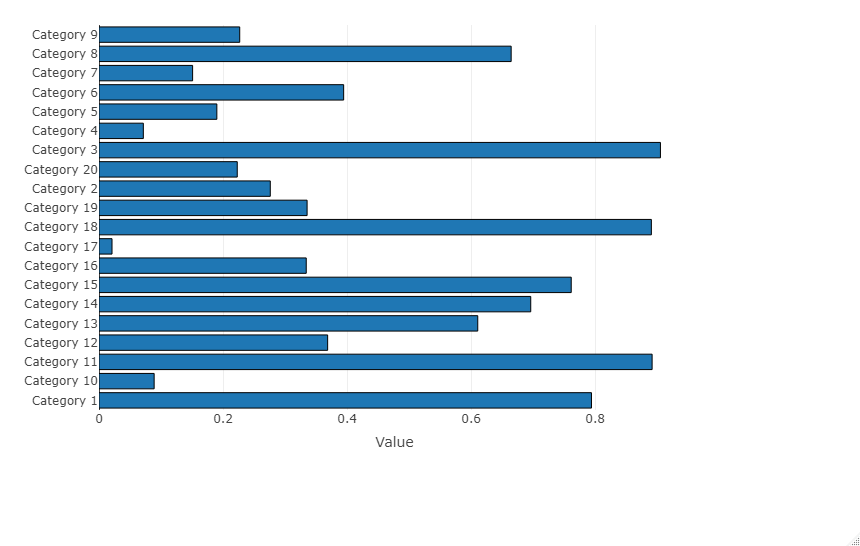
So far the solution prescribed online is to write a fixed formula for height and let Plotly auto-size itself. I took the cue from this site.
https://community.plotly.com/t/how-to-add-vertical-scroll-bar-on-horizontal-bar-chart/12342/2
The work-around suggests writing a formula on height based on the fixed formula
plot_height <- 500 + 10*nrow(df)
But this is not ideal. Sometimes I have only 1 category and the bar height is excessive. Sometimes I have 1000 categories and each of them looks like a stick.
I don't know. I thought having a fixed bar height for horizontal bar charts should be something quite fundamental, but it turns out exceedingly hard in Plotly.
Would appreciate any suggestions here.
コントリビューションガイド
はじめの一歩
- issue を最後まで読み、次にプロジェクトのコントリビューションガイドを読みます。
- 着手することを issue にコメントします — 二人が同じ作業をするのを防げます。
- リポジトリをフォークし、ブランチを切って変更します。
- issue 番号を参照したプルリクエストを送ります。
調査の方向性
再現可能な R の例から始め、特に plot_ly() と layout() のエントリポイントを確認し、リンクされている Plotly コミュニティの回避策を検討してください。グラフの高さを計算せずに、スクロールを伴う固定の水平バーサイズを Plotly がサポートしているかどうかを判断してください。完了とは、カテゴリ数が変動してもバーの高さを一定に保つ、文書化または実装されたアプローチがあることを意味します。
索引モデルが issue の本文から書いたものです。
評価
- 技術スタック
- plotly, r
- 領域
- data-visualization
- issue の種類
- 機能追加
- 難易度
- 5/5
- 見積もり時間
- 1週間以上
- 活発さ
- 停滞
- 明瞭さ
- おおむね明確
- 初心者へのやさしさ
- 35/100