Is there a way to fix bar height of horizontal bar charts in R Plotly?
Dieses Issue hat noch niemand übernommen.
- Vorherrschende Sprache
- R
- Sterne
- 2.7k
- Forks
- 641
- PR-Merge-Kennzahlen
- Keine gemergten PRs in 30 T.
Beschreibung
Not too sure if this question is asked before. I have been trying to look for solutions but to no avail.
I am trying to create a shiny dashboard with plotly. The thing is that I have earmarked a fixed space for the chart. And in this chart, it is a horizontal bar charts for many category.
Here is the minimally reproducible code.
library(tidyverse)
library(plotly)

tibble(Category = str_c("Category ", seq(1, 20, 1)),
       Value = runif(20)) %>%
  plot_ly(
    y = ~ Category,
    x = ~ Value,
    type = "bar",
    hoverinfo = "text",
    hovertemplate = ~paste0(
      "Category: ", Category, "<br>",
      "Value: ", Value,
      "<extra></extra>"
    ),
    marker = list(
      line = list(color = "#000000",
                  width = 1)
    )
  ) %>%
  layout(
    autosize = FALSE,
    showlegend = FALSE,
    xaxis = list(
      title = "Value"
    ),
    yaxis = list(
      title = ""
    )
  )
The issue is that sometimes the number of categories varies. It can be 20 in this case, it can go up to 100.
What I would like to have is to fix the height of the horizontal bar regardless of the number of categories. So if there are more categories, the height of each bar will stay constant and the vertical scroll will appear to accommodate the extra bars.
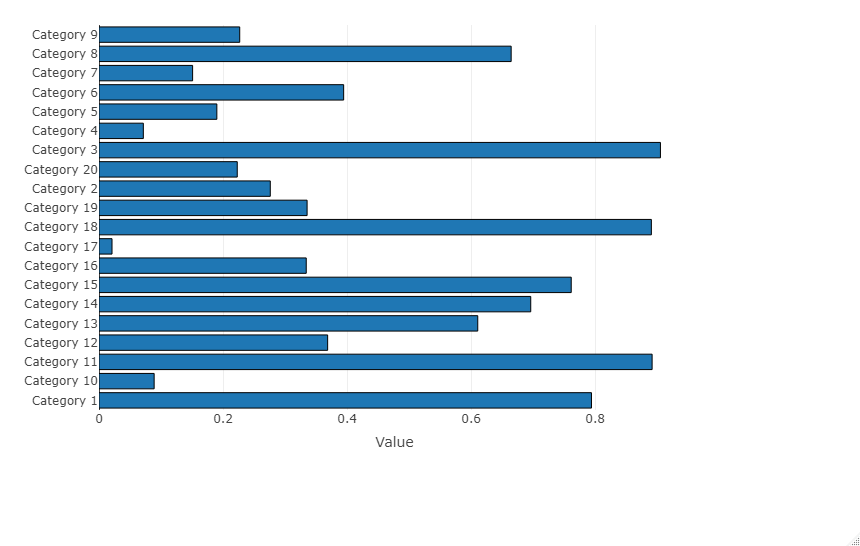
So far the solution prescribed online is to write a fixed formula for height and let Plotly auto-size itself. I took the cue from this site.
https://community.plotly.com/t/how-to-add-vertical-scroll-bar-on-horizontal-bar-chart/12342/2
The work-around suggests writing a formula on height based on the fixed formula
plot_height <- 500 + 10*nrow(df)
But this is not ideal. Sometimes I have only 1 category and the bar height is excessive. Sometimes I have 1000 categories and each of them looks like a stick.
I don't know. I thought having a fixed bar height for horizontal bar charts should be something quite fundamental, but it turns out exceedingly hard in Plotly.
Would appreciate any suggestions here.
Beitragsleitfaden
Erste Schritte
- Lies das ganze Issue und danach den Beitragsleitfaden des Projekts.
- Schreib ins Issue, dass du es übernimmst — das erspart doppelte Arbeit.
- Forke das Repository und arbeite in einem Branch.
- Öffne einen Pull Request, der die Issue-Nummer nennt.
Rechercherichtung
Beginnen Sie mit dem reproduzierbaren R-Beispiel, insbesondere mit den Einstiegspunkten plot_ly() und layout(), und prüfen Sie die verlinkte Plotly-Community-Lösung. Ermitteln Sie, ob Plotly eine feste horizontale Balkengröße mit Scrollen unterstützt, ohne die Diagrammhöhe zu berechnen. Erledigt bedeutet, dass ein dokumentierter oder implementierter Ansatz vorhanden ist, der bei einer variierenden Anzahl von Kategorien eine konsistente Balkenhöhe beibehält.
Vom Indexierungsmodell aus dem Issue-Text verfasst.
Bewertung
- Tech-Stack
- plotly, r
- Bereich
- data-visualization
- Issue-Typ
- Feature
- Schwierigkeit
- 5/5
- Geschätzter Aufwand
- Über eine Woche
- Aktivitätsstatus
- Veraltet
- Klarheit
- Größtenteils klar
- Anfängerfreundlichkeit
- 35/100