Markers are not alligned with bars when a double horizontal axis is used
Chưa có ai nhận issue này.
- Ngôn ngữ chính
- R
- Star
- 2.7k
- Fork
- 641
- Chỉ số merge pull request
- Không có pull request nào được merge trong 30 ngày
Mô tả
Plotly behaves strangely when two sets of data are superimposed, and there is a double horizontal axis.
Bars overlayed on bars give no issue: see the following reprex.
library(plotly)
#> Loading required package: ggplot2
#>
#> Attaching package: 'plotly'
#> The following object is masked from 'package:ggplot2':
#>
#>     last_plot
#> The following object is masked from 'package:stats':
#>
#>     filter
#> The following object is masked from 'package:graphics':
#>
#>     layout

plot_ly() %>%
  add_trace(x = ~1:31,
            y = ~1:31,
            name = 'blue data',
            type = 'bar') %>%
  add_trace(x = ~101:131,
            y = ~31:1,
            opacity = 0.7,
            name = 'orange data',
            type = 'bar',
            xaxis = 'x2') %>%
  layout(xaxis = list(title = ''),
         xaxis2 = list(
           overlaying = "x",
           side = "top")
  )
#> Warning: `arrange_()` is deprecated as of dplyr 0.7.0.
#> Please use `arrange()` instead.
#> See vignette('programming') for more help
#> This warning is displayed once every 8 hours.
#> Call `lifecycle::last_warnings()` to see where this warning was generated.
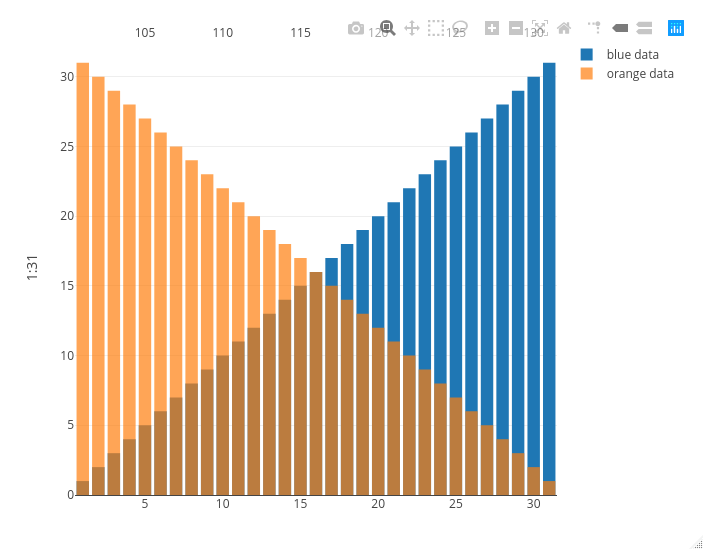
Created on 2020-10-29 by the reprex package (v0.3.0)
Now look at what happens if I replace the orange bars with orange markers: the second x axis on the top is squeezed between the second and the second to last bar, messing up the visualization.
library(plotly)
#> Loading required package: ggplot2
#>
#> Attaching package: 'plotly'
#> The following object is masked from 'package:ggplot2':
#>
#>     last_plot
#> The following object is masked from 'package:stats':
#>
#>     filter
#> The following object is masked from 'package:graphics':
#>
#>     layout

plot_ly() %>%
  add_trace(x = ~1:31,
            y = ~1:31,
            name = 'blue data',
            type = 'bar') %>%
  add_trace(x = ~101:131,
            y = ~31:1,
            opacity = 0.7,
            name = 'orange data',
            type = 'scatter',
            mode = 'markers',
            xaxis = 'x2') %>%
  layout(xaxis = list(title = ''),
         xaxis2 = list(
           overlaying = "x",
           side = "top")
  )
#> Warning: `arrange_()` is deprecated as of dplyr 0.7.0.
#> Please use `arrange()` instead.
#> See vignette('programming') for more help
#> This warning is displayed once every 8 hours.
#> Call `lifecycle::last_warnings()` to see where this warning was generated.
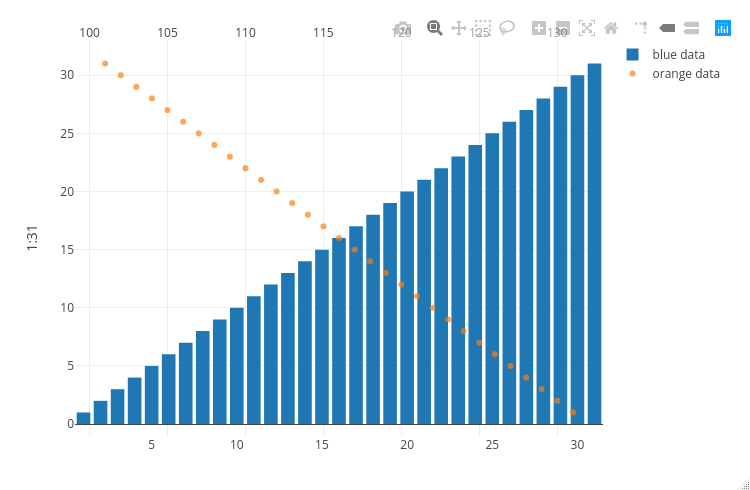
Created on 2020-10-29 by the reprex package (v0.3.0)
Hướng dẫn đóng góp
Bắt đầu từ đâu
- Đọc hết issue, rồi đọc hướng dẫn đóng góp của dự án.
- Bình luận trên issue rằng bạn sẽ nhận — tránh hai người làm cùng một việc.
- Fork repository và làm thay đổi trên một nhánh.
- Mở pull request có tham chiếu số hiệu của issue.
Hướng nghiên cứu
Bắt đầu bằng cách chạy hai ví dụ plot_ly() với add_trace() và layout(), so sánh trường hợp thanh và marker. Theo dõi cách các điểm đầu vào vẽ biểu đồ của R xử lý các cấu hình xaxis và xaxis2 chồng lớp; được xem là hoàn tất khi marker sử dụng cùng căn chỉnh ngang như các thanh mà không làm ép trục phía trên.
Do mô hình lập chỉ mục viết ra từ nội dung của issue.
Đánh giá
- Công nghệ
- r
- Lĩnh vực
- data-visualization
- Loại issue
- Lỗi
- Độ khó
- 4/5
- Thời gian dự kiến
- 3-5 ngày
- Mức độ hoạt động
- Đình trệ
- Độ rõ ràng
- Khá rõ ràng
- Mức phù hợp với người mới
- 35/100