Automargins cause imshow figure to jump around and change pixel size and labels spacing
Nobody has claimed this yet.
- Dominant language
- Python
- Stars
- 18.8k
- Forks
- 2.8k
- Avg merge
- 16h 26m
- Merged PRs (30d)
- 21
Description
I wasn't sure if this was a bug initially so I provided a reproducible example and closer description in the forum.
Briefly, with automargin=False, heatmaps of different figure sizes have the same pixel size:

Setting automargin=True creates figures with widely different pixel sizes and shifts where the figure appear and its whitespace (with more than just the label length):
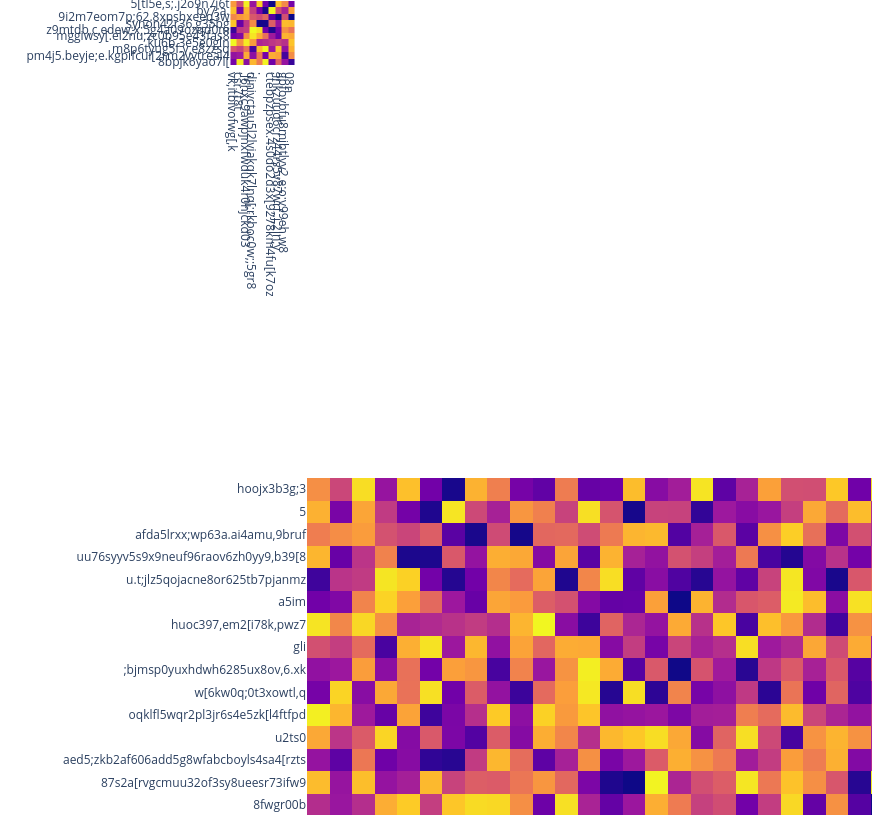
The jumping around behavior and inconsistent pixel sizes both seem to come from a bug in how the automargins are calculated or applied. A workaround is to set automargin=False and then manually specifying how much space is needed for the labels in the margin dictionary, e.g. margin=dict(t=100, b=0, l=80, r=0) and pad the overall figure size with these numbers, e.g. height = 100 + cut * 30.
It seems like the automargins are not correctly adding their label padding to the overall figure size, so that would be my suggestion for what could be a possible solution here.
Example code:
import plotly.express as px
import numpy as np
import pandas as pd


np.random.seed(20934)
img = np.random.rand(200, 200)
for cut in [10, 50]:
    fig = px.imshow(
        img[:cut, :cut],
        height=cut * 30,
        width=cut * 30,
        x = [''.join(np.random.choice(list('qwertyuioplkjhgfdsazxcvbnm,.;[098765432'), np.random.choice(40))) for x in range(cut)],
        y = [''.join(np.random.choice(list('qwertyuioplkjhgfdsazxcvbnm,.;[098765432'), np.random.choice(40))) for x in range(cut)],

    )
    fig.update_layout(
        coloraxis_showscale=False,
        margin=dict(t=0, b=0, l=0, r=0),
        xaxis_nticks=cut + 1,
        yaxis_nticks=cut + 1,
    ).update_xaxes(
        automargin=False,
    ).update_yaxes(
        automargin=False,
    )
    fig.show()
Contributor guide
First steps
- Read the whole issue, then the project's contributing guide.
- Comment on the issue to say you are picking it up — it saves two people doing the same work.
- Fork the repository and make your change on a branch.
- Open a pull request that references the issue number.
Research direction
Start with the provided Python px.imshow reproduction, comparing automargin=True with the manual margin workaround and checking x- and y-axis automargin behavior. Trace the automargin calculation or application used by update_xaxes and update_yaxes. Done means differently sized heatmaps keep consistent pixel sizing, positioning, and label spacing without manual margins.
Written by the indexing model from the issue text.
Assessment
- Tech stack
- python
- Domain
- data-visualization
- Issue type
- Bug
- Difficulty
- 4/5
- Estimated time
- 3-5 days
- Activity status
- Stale
- Clarity
- Mostly clear
- Newbie friendliness
- 35/100