Scattergl and px.line fill and continuous error bands don't appear
Chưa có ai nhận issue này.
- Ngôn ngữ chính
- Python
- Star
- 18.8k
- Fork
- 2.8k
- Merge trung bình
- 16 giờ 26 phút
- Pull request đã merge (30 ngày)
- 21
Mô tả
Summary
Using the fill and fillcolor parameters on scattergl traces (to produce continuous error bands, for example) does not work.
Issue
The issue is specific to scattergl traces: the same parameters work fine with scatter traces. To avoid the problem with plotly.express px.line() calls requires using render_mode="svg" to avoid the use of scattergl traces.
Using graph_objects has the some problem: one must use go.Scatter() and not go.Scattergl() to get error bands.
The reference for scattergl traces (https://plotly.com/python/reference/scattergl/#scattergl-fill) indicates that the behaviour should be the same as for scatter.
Specs
Python Version: 3.8.6
Plotly Version: 4.14.3
Kaleido Version: 0.2.1
- For image exports to be pasted here (they all looked the same as rendered in the browser)
Browsers: Firefox 88.0, Safari 12.1.1
Example
import numpy as np
import pandas as pd
import plotly.express as px

# dummy data
x = np.linspace(0, 10000, num=10_000)

df = pd.DataFrame({'x': x, 'y': x**2})
df['y_err_plus'] = df['y'] * 1.1
df['y_err_minus'] = df['y'] * 0.95
# use webgl and no fill

fig = (
px
 .line(
    df, x='x', y=['y', 'y_err_minus','y_err_plus'],
    render_mode='webgl')
 .update_traces(
     fill='tonexty', fillcolor='red',
     selector={'name':'y_err_plus'}
 )
)
fig
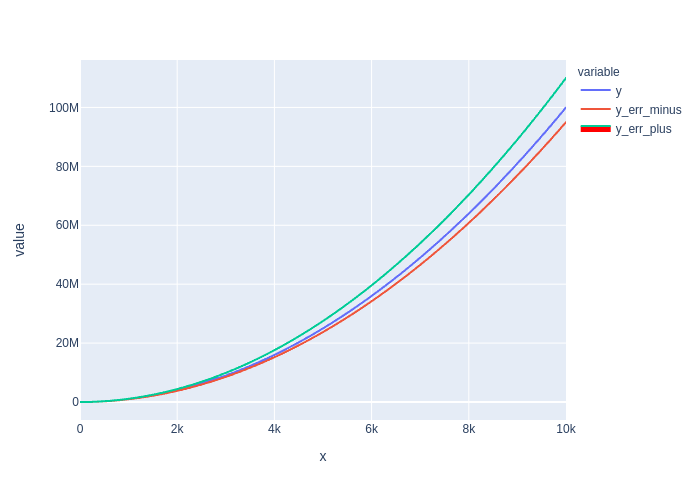
# use svg to get fill

fig = (
px
 .line(
    df, x='x', y=['y', 'y_err_minus','y_err_plus'],
    render_mode='svg')
 .update_traces(
     fill='tonexty', fillcolor='red',
     selector={'name':'y_err_plus'}
 )
)
fig
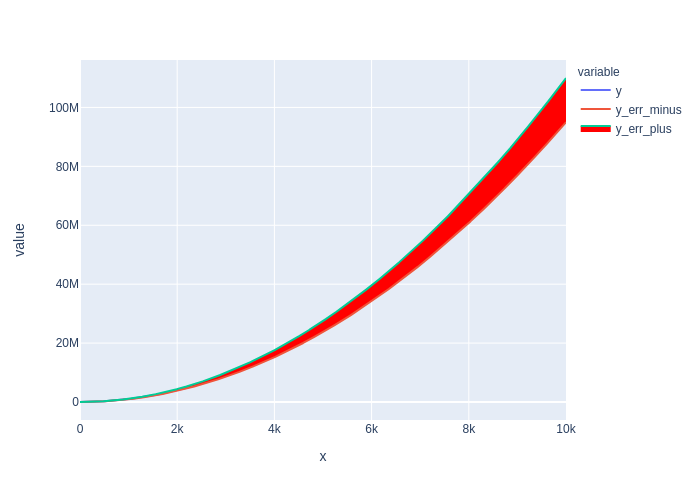
Sanity Check: fill to zero works?
Yes.
fig = (
px
.line(
    df, x='x', y='y',
    render_mode='webgl')
.update_traces(fill='tozeroy')
)

fig

Hướng dẫn đóng góp
Bắt đầu từ đâu
- Đọc hết issue, rồi đọc hướng dẫn đóng góp của dự án.
- Bình luận trên issue rằng bạn sẽ nhận — tránh hai người làm cùng một việc.
- Fork repository và làm thay đổi trên một nhánh.
- Mở pull request có tham chiếu số hiệu của issue.
Hướng nghiên cứu
Tái hiện vấn đề với px.line(render_mode="webgl") hoặc go.Scattergl() bằng cách sử dụng fill="tonexty" và fillcolor, sau đó so sánh với các trường hợp scatter và render_mode="svg" đang hoạt động đúng. Theo dõi đường dẫn kết xuất của scattergl và cách xử lý fill hiện có; hoàn thành khi các dải lỗi liên tục được kết xuất trong webgl, đồng thời hành vi tozeroy hiện có vẫn đúng.
Do mô hình lập chỉ mục viết ra từ nội dung của issue.
Đánh giá
- Công nghệ
- python
- Lĩnh vực
- data-visualization
- Loại issue
- Lỗi
- Độ khó
- 4/5
- Thời gian dự kiến
- 3-5 ngày
- Mức độ hoạt động
- Sôi nổi
- Độ rõ ràng
- Khá rõ ràng
- Mức phù hợp với người mới
- 55/100