Scattergl and px.line fill and continuous error bands don't appear
まだ誰も着手していません。
- 主要言語
- Python
- スター
- 18.8k
- フォーク
- 2.8k
- 平均マージ
- 16時間 26分
- マージ済み PR(30日)
- 21
説明
Summary
Using the fill and fillcolor parameters on scattergl traces (to produce continuous error bands, for example) does not work.
Issue
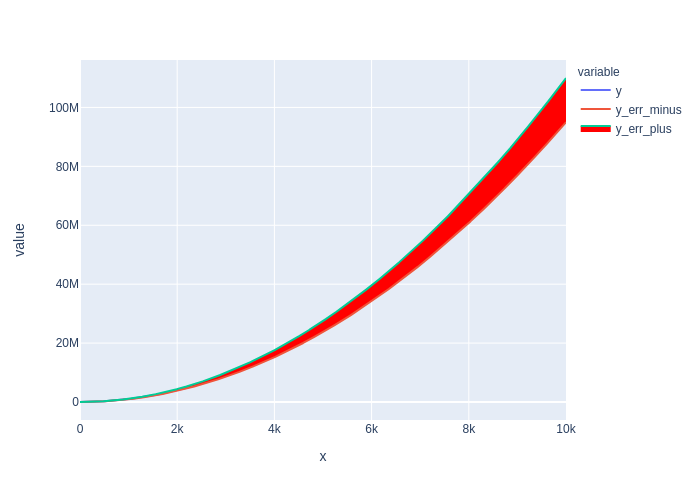
The issue is specific to scattergl traces: the same parameters work fine with scatter traces. To avoid the problem with plotly.express px.line() calls requires using render_mode="svg" to avoid the use of scattergl traces.
Using graph_objects has the some problem: one must use go.Scatter() and not go.Scattergl() to get error bands.
The reference for scattergl traces (https://plotly.com/python/reference/scattergl/#scattergl-fill) indicates that the behaviour should be the same as for scatter.
Specs
Python Version: 3.8.6
Plotly Version: 4.14.3
Kaleido Version: 0.2.1
- For image exports to be pasted here (they all looked the same as rendered in the browser)
Browsers: Firefox 88.0, Safari 12.1.1
Example
import numpy as np
import pandas as pd
import plotly.express as px

# dummy data
x = np.linspace(0, 10000, num=10_000)

df = pd.DataFrame({'x': x, 'y': x**2})
df['y_err_plus'] = df['y'] * 1.1
df['y_err_minus'] = df['y'] * 0.95
# use webgl and no fill

fig = (
px
 .line(
    df, x='x', y=['y', 'y_err_minus','y_err_plus'],
    render_mode='webgl')
 .update_traces(
     fill='tonexty', fillcolor='red',
     selector={'name':'y_err_plus'}
 )
)
fig
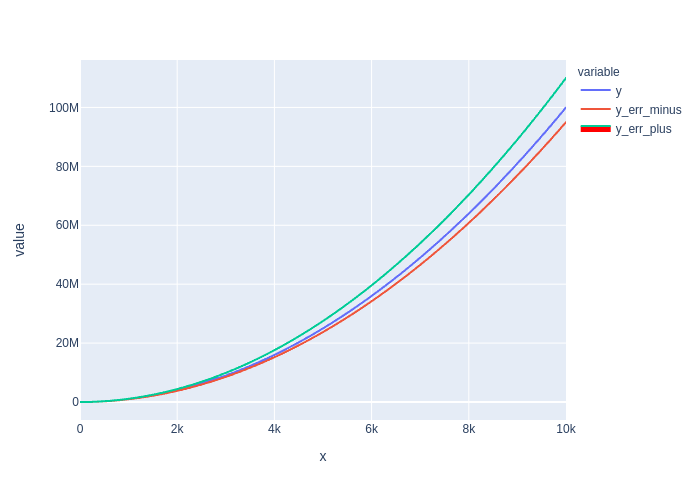
# use svg to get fill

fig = (
px
 .line(
    df, x='x', y=['y', 'y_err_minus','y_err_plus'],
    render_mode='svg')
 .update_traces(
     fill='tonexty', fillcolor='red',
     selector={'name':'y_err_plus'}
 )
)
fig
Sanity Check: fill to zero works?
Yes.
fig = (
px
.line(
    df, x='x', y='y',
    render_mode='webgl')
.update_traces(fill='tozeroy')
)

fig

コントリビューションガイド
はじめの一歩
- issue を最後まで読み、次にプロジェクトのコントリビューションガイドを読みます。
- 着手することを issue にコメントします — 二人が同じ作業をするのを防げます。
- リポジトリをフォークし、ブランチを切って変更します。
- issue 番号を参照したプルリクエストを送ります。
調査の方向性
fill="tonexty" と fillcolor を使用して px.line(render_mode="webgl") または go.Scattergl() で問題を再現し、動作している scatter と render_mode="svg" のケースと比較します。scattergl のレンダリングパスと既存の fill の処理を追跡します。webgl で連続したエラーバンドがレンダリングされ、既存の tozeroy の動作が引き続き正しい状態になれば完了です。
索引モデルが issue の本文から書いたものです。
評価
- 技術スタック
- python
- 領域
- data-visualization
- issue の種類
- バグ
- 難易度
- 4/5
- 見積もり時間
- 3〜5日
- 活発さ
- 活発
- 明瞭さ
- おおむね明確
- 初心者へのやさしさ
- 55/100