Scattergl and px.line fill and continuous error bands don't appear
Nadie ha tomado este issue todavía.
- Lenguaje dominante
- Python
- Estrellas
- 18.8k
- Forks
- 2.8k
- Merge medio
- 16 h 26 min
- PR fusionados (30 d)
- 21
Descripción
Summary
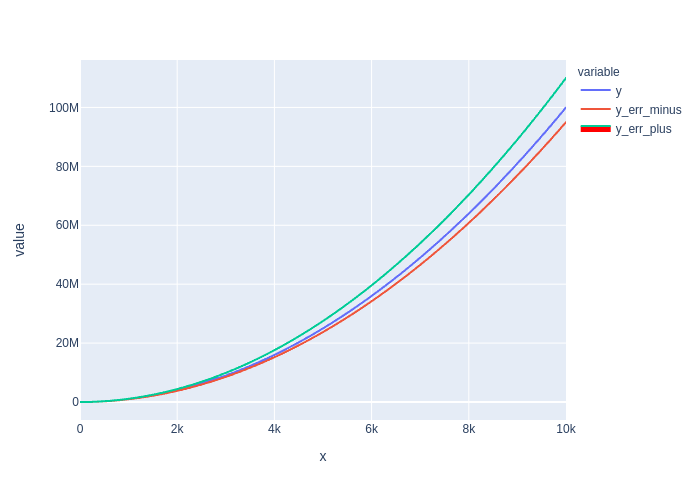
Using the fill and fillcolor parameters on scattergl traces (to produce continuous error bands, for example) does not work.
Issue
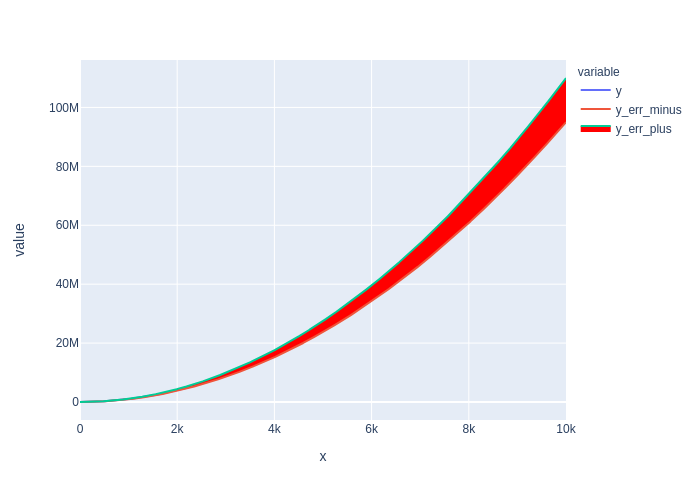
The issue is specific to scattergl traces: the same parameters work fine with scatter traces. To avoid the problem with plotly.express px.line() calls requires using render_mode="svg" to avoid the use of scattergl traces.
Using graph_objects has the some problem: one must use go.Scatter() and not go.Scattergl() to get error bands.
The reference for scattergl traces (https://plotly.com/python/reference/scattergl/#scattergl-fill) indicates that the behaviour should be the same as for scatter.
Specs
Python Version: 3.8.6
Plotly Version: 4.14.3
Kaleido Version: 0.2.1
- For image exports to be pasted here (they all looked the same as rendered in the browser)
Browsers: Firefox 88.0, Safari 12.1.1
Example
import numpy as np
import pandas as pd
import plotly.express as px

# dummy data
x = np.linspace(0, 10000, num=10_000)

df = pd.DataFrame({'x': x, 'y': x**2})
df['y_err_plus'] = df['y'] * 1.1
df['y_err_minus'] = df['y'] * 0.95
# use webgl and no fill

fig = (
px
 .line(
    df, x='x', y=['y', 'y_err_minus','y_err_plus'],
    render_mode='webgl')
 .update_traces(
     fill='tonexty', fillcolor='red',
     selector={'name':'y_err_plus'}
 )
)
fig
# use svg to get fill

fig = (
px
 .line(
    df, x='x', y=['y', 'y_err_minus','y_err_plus'],
    render_mode='svg')
 .update_traces(
     fill='tonexty', fillcolor='red',
     selector={'name':'y_err_plus'}
 )
)
fig
Sanity Check: fill to zero works?
Yes.
fig = (
px
.line(
    df, x='x', y='y',
    render_mode='webgl')
.update_traces(fill='tozeroy')
)

fig

Guía de contribución
Primeros pasos
- Lee el issue completo y luego la guía de contribución del proyecto.
- Comenta en el issue que vas a ocuparte — evita que dos personas hagan lo mismo.
- Haz un fork del repositorio y trabaja en una rama.
- Abre un pull request que haga referencia al número del issue.
Línea de trabajo
Reproduce el problema con px.line(render_mode="webgl") o go.Scattergl() usando fill="tonexty" y fillcolor, y compáralo después con los casos funcionales de scatter y render_mode="svg". Sigue la ruta de renderizado de scattergl y el manejo existente de fill; el trabajo estará terminado cuando las bandas de error continuas se rendericen en webgl, mientras el comportamiento existente de tozeroy siga siendo correcto.
Escrito por el modelo de indexación a partir del texto del issue.
Evaluación
- Stack tecnológico
- python
- Área
- data-visualization
- Tipo de issue
- Error
- Dificultad
- 4/5
- Tiempo estimado
- 3-5 días
- Estado de actividad
- Activo
- Claridad
- Bastante claro
- Aptitud para principiantes
- 55/100