Scattergl and px.line fill and continuous error bands don't appear
Dieses Issue hat noch niemand übernommen.
- Vorherrschende Sprache
- Python
- Sterne
- 18.8k
- Forks
- 2.8k
- Ø Merge
- 16 Std. 26 Min.
- Gemergte PRs (30 T.)
- 21
Beschreibung
Summary
Using the fill and fillcolor parameters on scattergl traces (to produce continuous error bands, for example) does not work.
Issue
The issue is specific to scattergl traces: the same parameters work fine with scatter traces. To avoid the problem with plotly.express px.line() calls requires using render_mode="svg" to avoid the use of scattergl traces.
Using graph_objects has the some problem: one must use go.Scatter() and not go.Scattergl() to get error bands.
The reference for scattergl traces (https://plotly.com/python/reference/scattergl/#scattergl-fill) indicates that the behaviour should be the same as for scatter.
Specs
Python Version: 3.8.6
Plotly Version: 4.14.3
Kaleido Version: 0.2.1
- For image exports to be pasted here (they all looked the same as rendered in the browser)
Browsers: Firefox 88.0, Safari 12.1.1
Example
import numpy as np
import pandas as pd
import plotly.express as px

# dummy data
x = np.linspace(0, 10000, num=10_000)

df = pd.DataFrame({'x': x, 'y': x**2})
df['y_err_plus'] = df['y'] * 1.1
df['y_err_minus'] = df['y'] * 0.95
# use webgl and no fill

fig = (
px
 .line(
    df, x='x', y=['y', 'y_err_minus','y_err_plus'],
    render_mode='webgl')
 .update_traces(
     fill='tonexty', fillcolor='red',
     selector={'name':'y_err_plus'}
 )
)
fig
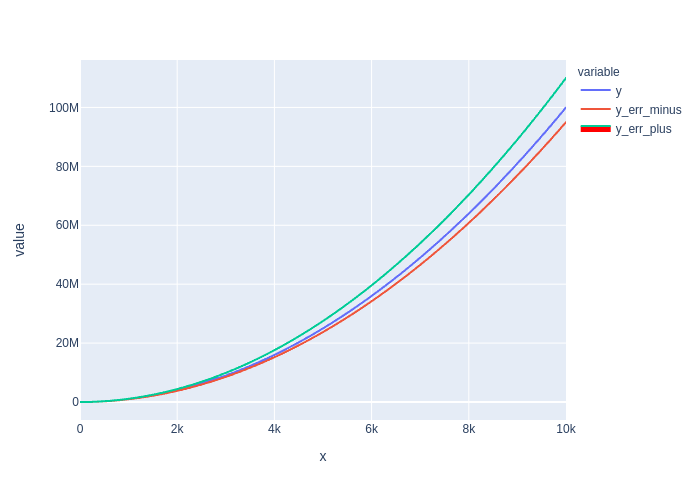
# use svg to get fill

fig = (
px
 .line(
    df, x='x', y=['y', 'y_err_minus','y_err_plus'],
    render_mode='svg')
 .update_traces(
     fill='tonexty', fillcolor='red',
     selector={'name':'y_err_plus'}
 )
)
fig
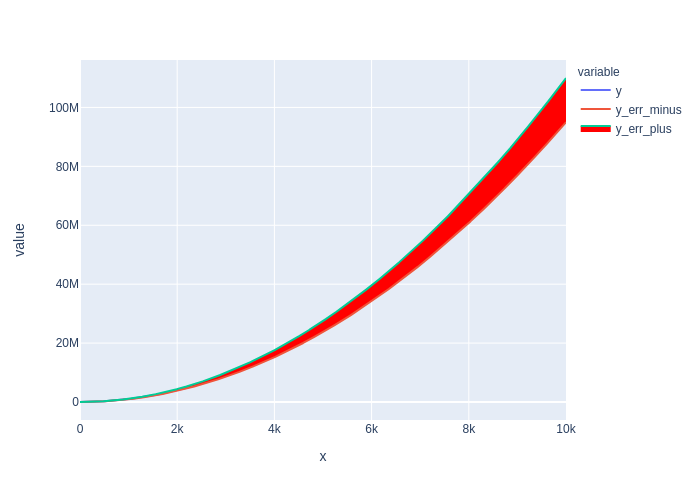
Sanity Check: fill to zero works?
Yes.
fig = (
px
.line(
    df, x='x', y='y',
    render_mode='webgl')
.update_traces(fill='tozeroy')
)

fig

Beitragsleitfaden
Erste Schritte
- Lies das ganze Issue und danach den Beitragsleitfaden des Projekts.
- Schreib ins Issue, dass du es übernimmst — das erspart doppelte Arbeit.
- Forke das Repository und arbeite in einem Branch.
- Öffne einen Pull Request, der die Issue-Nummer nennt.
Rechercherichtung
Reproduziere das Problem mit px.line(render_mode="webgl") oder go.Scattergl() unter Verwendung von fill="tonexty" und fillcolor und vergleiche es anschließend mit den funktionierenden Fällen von scatter und render_mode="svg". Verfolge den Rendering-Pfad von scattergl und die bestehende Behandlung von fill; abgeschlossen ist die Aufgabe, wenn kontinuierliche Fehlerbänder in webgl gerendert werden, während das bestehende tozeroy-Verhalten weiterhin korrekt bleibt.
Vom Indexierungsmodell aus dem Issue-Text verfasst.
Bewertung
- Tech-Stack
- python
- Bereich
- data-visualization
- Issue-Typ
- Bug
- Schwierigkeit
- 4/5
- Geschätzter Aufwand
- 3-5 Tage
- Aktivitätsstatus
- Aktiv
- Klarheit
- Größtenteils klar
- Anfängerfreundlichkeit
- 55/100