Events such as on_click in charts/figures with multiple traces only receive point ids for one trace
まだ誰も着手していません。
- 主要言語
- Python
- スター
- 18.8k
- フォーク
- 2.8k
- 平均マージ
- 16時間 26分
- マージ済み PR(30日)
- 21
説明
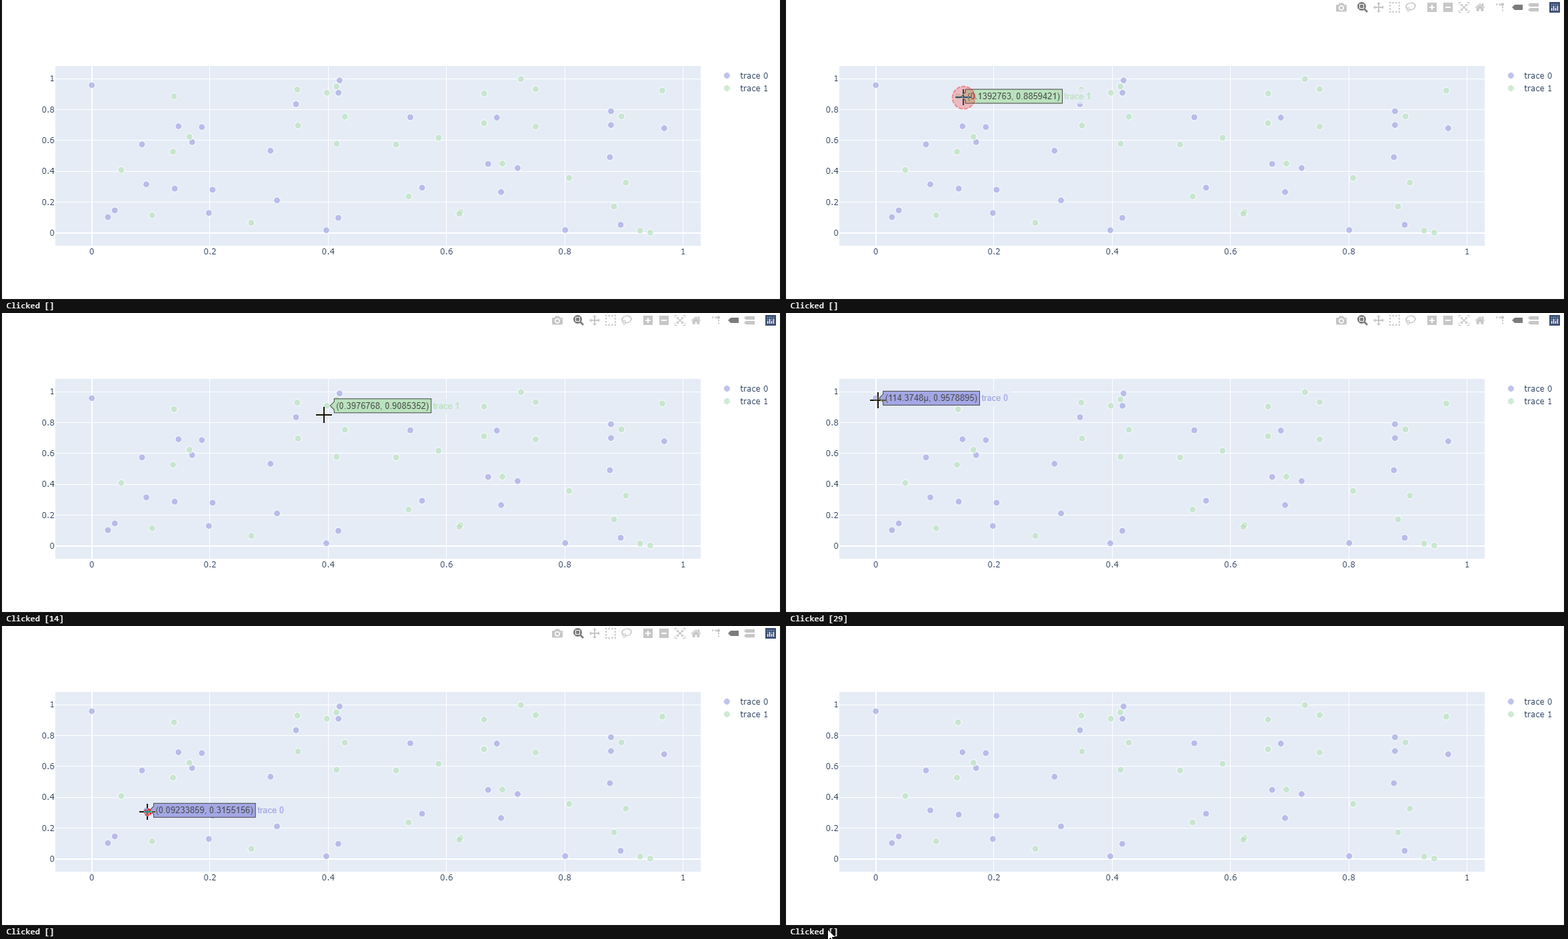
For figures that have multiple traces it is not possible to get the id of the clicked trace points for all traces, only one. This is a problem when trying to display details for clicked points of multiple traces.
The example below shows how to reproduce the behaviour with plotly 4.9.0 in a Jupyter notebook. When clicking on the green points, the text below the chart shows the id of the clicked point but when clicking on one of the purple points, the id is empty.
Could you kindly take a look?
import plotly.graph_objects as go
from ipywidgets import Output, VBox

import numpy as np
np.random.seed(1)
out = Output()

# create our callback function
@out.capture(clear_output=True)
def update_point(trace, points, selector):
    print(f'Clicked {points.point_inds}')

def create_scatter(colour):
    scatter = go.Scatter(x=np.random.rand(30), y=np.random.rand(30), mode='markers')
    colors =  [colour] * 30
    scatter.marker.color = colors
    scatter.marker.size = [10] * 30
    return scatter

scatter1 = create_scatter(colour='#a3a7e4')
scatter2 = create_scatter(colour='#bae2be')
fig = go.FigureWidget([scatter1, scatter2])
fig.data[0].on_click(update_point)
fig.data[1].on_click(update_point)
fig.layout.hovermode = 'closest'

VBox([fig, out])
コントリビューションガイド
はじめの一歩
- issue を最後まで読み、次にプロジェクトのコントリビューションガイドを読みます。
- 着手することを issue にコメントします — 二人が同じ作業をするのを防げます。
- リポジトリをフォークし、ブランチを切って変更します。
- issue 番号を参照したプルリクエストを送ります。
調査の方向性
提供された Jupyter notebook で FigureWidget、2 つの Scatter トレース、および個別の on_click コールバックを使用して問題を再現します。FigureWidget のトレースコールバックパスから調査を開始し、各トレースで points.point_inds がどのように設定されるかを確認します。どちらかのトレースのポイントをクリックしたときに、空の値ではなくクリックしたポイントの ID が報告されれば完了です。
索引モデルが issue の本文から書いたものです。
評価
- 技術スタック
- jupyter-notebook, python
- 領域
- data-visualization
- issue の種類
- バグ
- 難易度
- 4/5
- 見積もり時間
- 3〜5日
- 活発さ
- 停滞
- 明瞭さ
- おおむね明確
- 初心者へのやさしさ
- 35/100