Events such as on_click in charts/figures with multiple traces only receive point ids for one trace
Nobody has claimed this yet.
- Dominant language
- Python
- Stars
- 18.8k
- Forks
- 2.8k
- Avg merge
- 16h 26m
- Merged PRs (30d)
- 21
Description
For figures that have multiple traces it is not possible to get the id of the clicked trace points for all traces, only one. This is a problem when trying to display details for clicked points of multiple traces.
The example below shows how to reproduce the behaviour with plotly 4.9.0 in a Jupyter notebook. When clicking on the green points, the text below the chart shows the id of the clicked point but when clicking on one of the purple points, the id is empty.
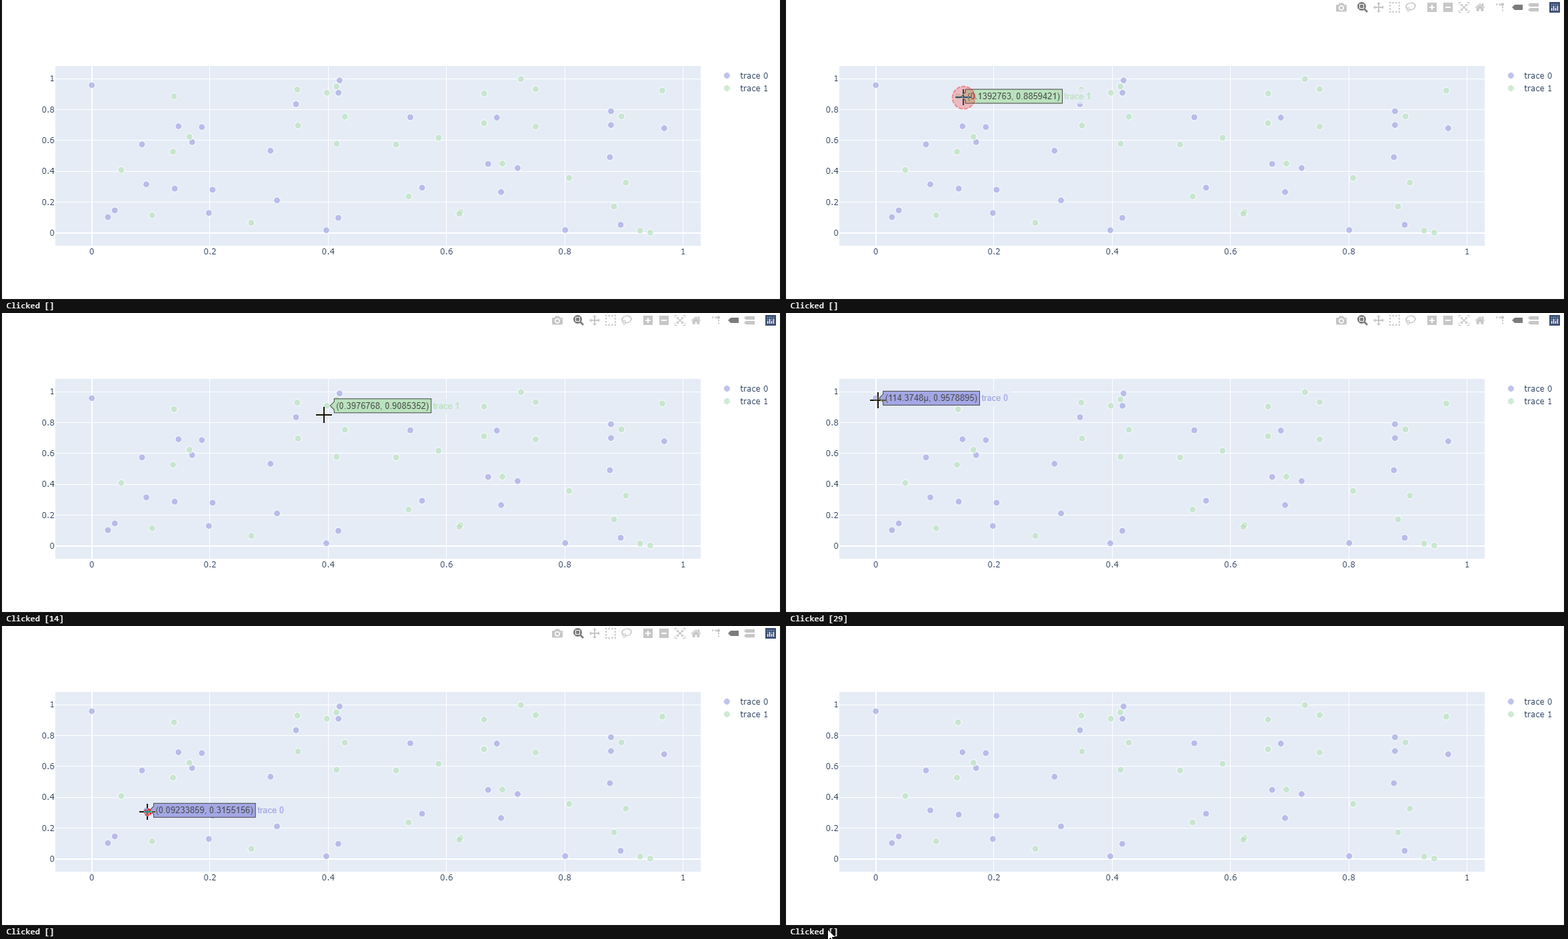
Could you kindly take a look?
import plotly.graph_objects as go
from ipywidgets import Output, VBox

import numpy as np
np.random.seed(1)
out = Output()

# create our callback function
@out.capture(clear_output=True)
def update_point(trace, points, selector):
    print(f'Clicked {points.point_inds}')

def create_scatter(colour):
    scatter = go.Scatter(x=np.random.rand(30), y=np.random.rand(30), mode='markers')
    colors =  [colour] * 30
    scatter.marker.color = colors
    scatter.marker.size = [10] * 30
    return scatter

scatter1 = create_scatter(colour='#a3a7e4')
scatter2 = create_scatter(colour='#bae2be')
fig = go.FigureWidget([scatter1, scatter2])
fig.data[0].on_click(update_point)
fig.data[1].on_click(update_point)
fig.layout.hovermode = 'closest'

VBox([fig, out])
Contributor guide
First steps
- Read the whole issue, then the project's contributing guide.
- Comment on the issue to say you are picking it up — it saves two people doing the same work.
- Fork the repository and make your change on a branch.
- Open a pull request that references the issue number.
Research direction
Reproduce the issue in the provided Jupyter notebook using FigureWidget, two Scatter traces, and separate on_click callbacks. Start at the FigureWidget trace callback path and inspect how points.point_inds is populated for each trace. Done means clicking points in either trace reports the clicked point id rather than an empty value.
Written by the indexing model from the issue text.
Assessment
- Tech stack
- jupyter-notebook, python
- Domain
- data-visualization
- Issue type
- Bug
- Difficulty
- 4/5
- Estimated time
- 3-5 days
- Activity status
- Stale
- Clarity
- Mostly clear
- Newbie friendliness
- 35/100