Events such as on_click in charts/figures with multiple traces only receive point ids for one trace
Dieses Issue hat noch niemand übernommen.
- Vorherrschende Sprache
- Python
- Sterne
- 18.8k
- Forks
- 2.8k
- Ø Merge
- 16 Std. 26 Min.
- Gemergte PRs (30 T.)
- 21
Beschreibung
For figures that have multiple traces it is not possible to get the id of the clicked trace points for all traces, only one. This is a problem when trying to display details for clicked points of multiple traces.
The example below shows how to reproduce the behaviour with plotly 4.9.0 in a Jupyter notebook. When clicking on the green points, the text below the chart shows the id of the clicked point but when clicking on one of the purple points, the id is empty.
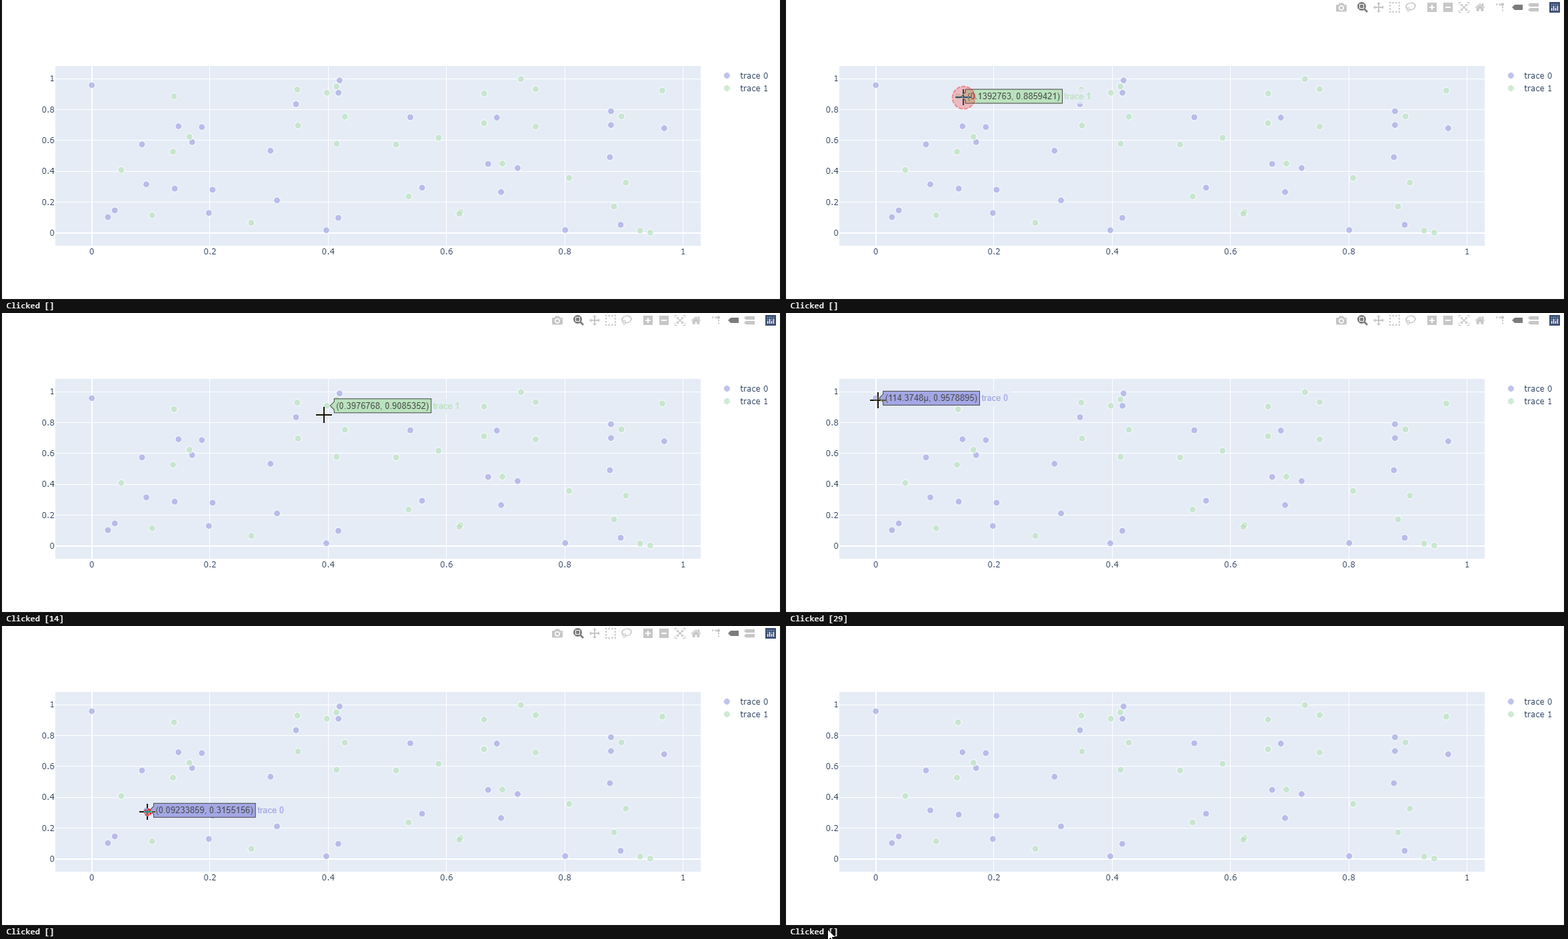
Could you kindly take a look?
import plotly.graph_objects as go
from ipywidgets import Output, VBox

import numpy as np
np.random.seed(1)
out = Output()

# create our callback function
@out.capture(clear_output=True)
def update_point(trace, points, selector):
    print(f'Clicked {points.point_inds}')

def create_scatter(colour):
    scatter = go.Scatter(x=np.random.rand(30), y=np.random.rand(30), mode='markers')
    colors =  [colour] * 30
    scatter.marker.color = colors
    scatter.marker.size = [10] * 30
    return scatter

scatter1 = create_scatter(colour='#a3a7e4')
scatter2 = create_scatter(colour='#bae2be')
fig = go.FigureWidget([scatter1, scatter2])
fig.data[0].on_click(update_point)
fig.data[1].on_click(update_point)
fig.layout.hovermode = 'closest'

VBox([fig, out])
Beitragsleitfaden
Erste Schritte
- Lies das ganze Issue und danach den Beitragsleitfaden des Projekts.
- Schreib ins Issue, dass du es übernimmst — das erspart doppelte Arbeit.
- Forke das Repository und arbeite in einem Branch.
- Öffne einen Pull Request, der die Issue-Nummer nennt.
Rechercherichtung
Reproduziere das Problem im bereitgestellten Jupyter notebook mit FigureWidget, zwei Scatter-Traces und separaten on_click-Callbacks. Beginne beim Trace-Callback-Pfad von FigureWidget und untersuche, wie points.point_inds für jeden Trace gefüllt wird. Fertig ist es, wenn das Klicken auf Punkte in einem der beiden Traces die ID des angeklickten Punkts statt eines leeren Werts meldet.
Vom Indexierungsmodell aus dem Issue-Text verfasst.
Bewertung
- Tech-Stack
- jupyter-notebook, python
- Bereich
- data-visualization
- Issue-Typ
- Bug
- Schwierigkeit
- 4/5
- Geschätzter Aufwand
- 3-5 Tage
- Aktivitätsstatus
- Veraltet
- Klarheit
- Größtenteils klar
- Anfängerfreundlichkeit
- 35/100