Date tickformats automatically replaces newline \n with <br>. Causing the same value on the second line to repeat.
まだ誰も着手していません。
- 主要言語
- R
- スター
- 2.7k
- フォーク
- 641
- PR マージ指標
- 30日以内にマージされた PR はありません
説明
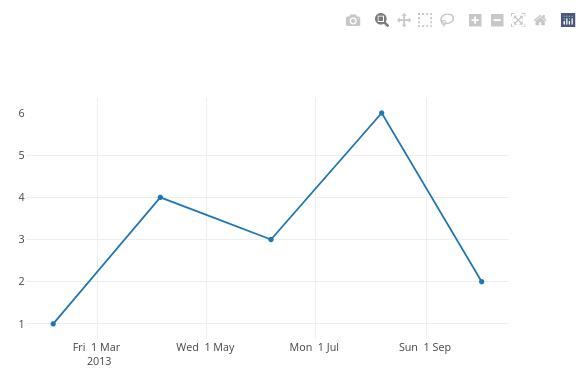
Custom date tickformat does not respect the newline character \n and automatically replaces it by a break-tag <br />. This has the consequence that values after the specified newline get repeated for each tick-label even though the value is the same.
As this python plotly documentation mentions:
Date axis tick labels have the special property that any portion after the first instance of '\n' in tickformat will appear on a second line only once per unique value, as with the year numbers in the example below. To have the year number appear on every tick label, '<br>' should be used instead of '\n'.
Ploty python and javascript respect the \n but not R.
Minimal example:
library(plotly)
#> loading comments I have committed for this reprex
dt <- data.frame(
    x = as.Date(c('2013-02-04', '2013-04-05', '2013-06-06', '2013-08-07', '2013-10-02')),
    y = c(1,4,5,6,2)
  )
plot_ly(data = dt, x = ~x, y = ~y, type = 'scatter', mode = 'lines') %>%
  layout(xaxis = list(tickformat = '%a %e %b \n %Y'))

Created on 2022-03-31 by the reprex package (v2.0.1)
In specting the above object with plotly_json() and search for tickformat reveals that the format has been updated to: %a %e %b <br /> %Y.
This reprex is an example taken from the javascript documentation where the example shows the correct behaviour of only showing the year 2013 once.
コントリビューションガイド
はじめの一歩
- issue を最後まで読み、次にプロジェクトのコントリビューションガイドを読みます。
- 着手することを issue にコメントします — 二人が同じ作業をするのを防げます。
- リポジトリをフォークし、ブランチを切って変更します。
- issue 番号を参照したプルリクエストを送ります。
調査の方向性
issue #2115 の R の最小例から始め、plotly_json() でその出力を調べ、x 軸の tickformat が \n をどのように変換するかに注目してください。結果を、リンクされている JavaScript と Python の動作と比較してください。R が \n を保持し、繰り返される日付値がドキュメントに記載された動作に従って表示されれば完了です。
索引モデルが issue の本文から書いたものです。
評価
- 技術スタック
- javascript, r
- 領域
- data-visualization
- issue の種類
- バグ
- 難易度
- 3/5
- 見積もり時間
- 1〜2日
- 活発さ
- 停滞
- 明瞭さ
- おおむね明確
- 初心者へのやさしさ
- 45/100