Date tickformats automatically replaces newline \n with <br>. Causing the same value on the second line to repeat.
Personne n'a encore pris cette issue.
- Langage dominant
- R
- Étoiles
- 2.7k
- Forks
- 641
- Métriques de merge des PR
- Aucune PR mergée en 30 j
Description
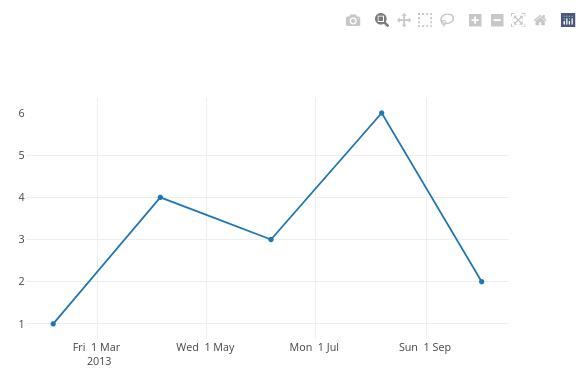
Custom date tickformat does not respect the newline character \n and automatically replaces it by a break-tag <br />. This has the consequence that values after the specified newline get repeated for each tick-label even though the value is the same.
As this python plotly documentation mentions:
Date axis tick labels have the special property that any portion after the first instance of '\n' in tickformat will appear on a second line only once per unique value, as with the year numbers in the example below. To have the year number appear on every tick label, '<br>' should be used instead of '\n'.
Ploty python and javascript respect the \n but not R.
Minimal example:
library(plotly)
#> loading comments I have committed for this reprex
dt <- data.frame(
    x = as.Date(c('2013-02-04', '2013-04-05', '2013-06-06', '2013-08-07', '2013-10-02')),
    y = c(1,4,5,6,2)
  )
plot_ly(data = dt, x = ~x, y = ~y, type = 'scatter', mode = 'lines') %>%
  layout(xaxis = list(tickformat = '%a %e %b \n %Y'))

Created on 2022-03-31 by the reprex package (v2.0.1)
In specting the above object with plotly_json() and search for tickformat reveals that the format has been updated to: %a %e %b <br /> %Y.
This reprex is an example taken from the javascript documentation where the example shows the correct behaviour of only showing the year 2013 once.
Guide de contribution
Ouvrir le guide de contribution
Par où commencer
- Lisez l'issue en entier, puis le guide de contribution du projet.
- Signalez en commentaire que vous la prenez — cela évite que deux personnes fassent le même travail.
- Forkez le dépôt et travaillez sur une branche.
- Ouvrez une pull request qui référence le numéro de l'issue.
Piste de recherche
Commencez par l’exemple minimal en R dans issue #2115 et inspectez sa sortie avec plotly_json(), en vous concentrant sur la manière dont le tickformat de l’axe x convertit \n. Comparez le résultat avec le comportement lié de JavaScript et Python ; le travail est terminé lorsque R conserve \n afin que les valeurs de date répétées soient affichées conformément au comportement documenté.
Rédigé par le modèle d'indexation à partir du texte de l'issue.
Évaluation
- Stack technique
- javascript, r
- Domaine
- data-visualization
- Type d'issue
- Bug
- Difficulté
- 3/5
- Temps estimé
- 1-2 jours
- Activité
- À l'abandon
- Clarté
- Plutôt claire
- Accessibilité débutants
- 45/100