Date tickformats automatically replaces newline \n with <br>. Causing the same value on the second line to repeat.
还没有人认领这个 Issue。
- 主要语言
- R
- 星标
- 2.7k
- 派生
- 641
- PR 合并指标
- 30 天内没有已合并 PR
描述
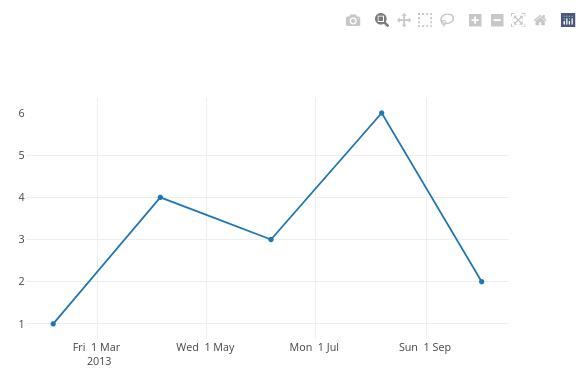
Custom date tickformat does not respect the newline character \n and automatically replaces it by a break-tag <br />. This has the consequence that values after the specified newline get repeated for each tick-label even though the value is the same.
As this python plotly documentation mentions:
Date axis tick labels have the special property that any portion after the first instance of '\n' in tickformat will appear on a second line only once per unique value, as with the year numbers in the example below. To have the year number appear on every tick label, '<br>' should be used instead of '\n'.
Ploty python and javascript respect the \n but not R.
Minimal example:
library(plotly)
#> loading comments I have committed for this reprex
dt <- data.frame(
    x = as.Date(c('2013-02-04', '2013-04-05', '2013-06-06', '2013-08-07', '2013-10-02')),
    y = c(1,4,5,6,2)
  )
plot_ly(data = dt, x = ~x, y = ~y, type = 'scatter', mode = 'lines') %>%
  layout(xaxis = list(tickformat = '%a %e %b \n %Y'))

Created on 2022-03-31 by the reprex package (v2.0.1)
In specting the above object with plotly_json() and search for tickformat reveals that the format has been updated to: %a %e %b <br /> %Y.
This reprex is an example taken from the javascript documentation where the example shows the correct behaviour of only showing the year 2013 once.
贡献指南
从这里开始
- 先读完整个 Issue,再读项目的贡献指南。
- 在 Issue 下留言说明你要接手 —— 这能避免两个人做同样的事。
- Fork 仓库,在一个分支上完成修改。
- 提交 Pull Request,并在描述里引用这个 Issue 编号。
调研方向
从 issue #2115 中的 R 最小示例开始,使用 plotly_json() 检查其输出,重点关注 x 轴 tickformat 如何转换 \n。将结果与链接的 JavaScript 和 Python 行为进行比较;当 R 保留 \n,使重复的日期值按照文档所述的行为显示时,即表示完成。
由索引模型根据 Issue 内容生成。
评估
- 技术栈
- javascript, r
- 领域
- data-visualization
- Issue 类型
- 缺陷
- 难度
- 3/5
- 预计耗时
- 1-2 天
- 活跃度
- 停滞
- 描述清晰度
- 基本清楚
- 新手友好度
- 45/100