Date tickformats automatically replaces newline \n with <br>. Causing the same value on the second line to repeat.
Nessuno ha ancora preso questa issue.
- Lingua principale
- R
- Stelle
- 2.7k
- Fork
- 641
- Metriche di merge delle PR
- Nessuna PR unita negli ultimi 30g
Descrizione
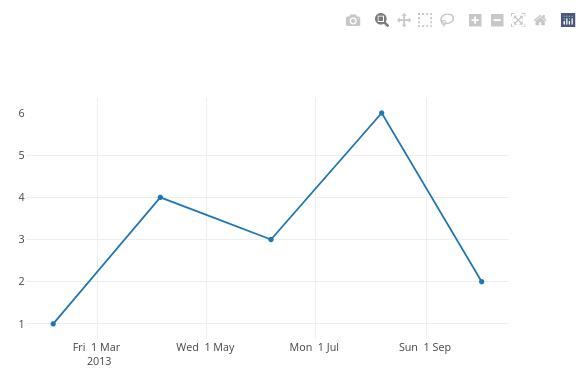
Custom date tickformat does not respect the newline character \n and automatically replaces it by a break-tag <br />. This has the consequence that values after the specified newline get repeated for each tick-label even though the value is the same.
As this python plotly documentation mentions:
Date axis tick labels have the special property that any portion after the first instance of '\n' in tickformat will appear on a second line only once per unique value, as with the year numbers in the example below. To have the year number appear on every tick label, '<br>' should be used instead of '\n'.
Ploty python and javascript respect the \n but not R.
Minimal example:
library(plotly)
#> loading comments I have committed for this reprex
dt <- data.frame(
    x = as.Date(c('2013-02-04', '2013-04-05', '2013-06-06', '2013-08-07', '2013-10-02')),
    y = c(1,4,5,6,2)
  )
plot_ly(data = dt, x = ~x, y = ~y, type = 'scatter', mode = 'lines') %>%
  layout(xaxis = list(tickformat = '%a %e %b \n %Y'))

Created on 2022-03-31 by the reprex package (v2.0.1)
In specting the above object with plotly_json() and search for tickformat reveals that the format has been updated to: %a %e %b <br /> %Y.
This reprex is an example taken from the javascript documentation where the example shows the correct behaviour of only showing the year 2013 once.
Guida per i contributori
Apri la guida per i contributori
Come iniziare
- Leggi tutta la issue e poi la guida ai contributi del progetto.
- Commenta sulla issue per dire che te ne occupi tu — evita che due persone facciano lo stesso lavoro.
- Fai un fork del repository e lavora su un branch.
- Apri una pull request che faccia riferimento al numero della issue.
Direzione di ricerca
Inizia con l’esempio minimo in R nell’issue #2115 e ispezionane l’output con plotly_json(), concentrandoti su come il tickformat dell’asse x converte \n. Confronta il risultato con il comportamento collegato di JavaScript e Python; il lavoro è completato quando R conserva \n, in modo che i valori di data ripetuti vengano visualizzati secondo il comportamento documentato.
Scritto dal modello di indicizzazione a partire dal testo della issue.
Valutazione
- Stack tecnologico
- javascript, r
- Ambito
- data-visualization
- Tipo di issue
- Bug
- Difficoltà
- 3/5
- Tempo stimato
- 1-2 giorni
- Stato di attività
- Ferma
- Chiarezza
- Abbastanza chiara
- Idoneità per principianti
- 45/100