Date tickformats automatically replaces newline \n with <br>. Causing the same value on the second line to repeat.
Nadie ha tomado este issue todavía.
- Lenguaje dominante
- R
- Estrellas
- 2.7k
- Forks
- 641
- Métricas de merge de PR
- Sin PR fusionados en 30 d
Descripción
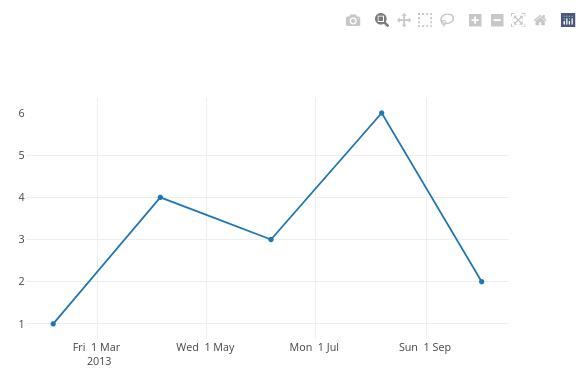
Custom date tickformat does not respect the newline character \n and automatically replaces it by a break-tag <br />. This has the consequence that values after the specified newline get repeated for each tick-label even though the value is the same.
As this python plotly documentation mentions:
Date axis tick labels have the special property that any portion after the first instance of '\n' in tickformat will appear on a second line only once per unique value, as with the year numbers in the example below. To have the year number appear on every tick label, '<br>' should be used instead of '\n'.
Ploty python and javascript respect the \n but not R.
Minimal example:
library(plotly)
#> loading comments I have committed for this reprex
dt <- data.frame(
    x = as.Date(c('2013-02-04', '2013-04-05', '2013-06-06', '2013-08-07', '2013-10-02')),
    y = c(1,4,5,6,2)
  )
plot_ly(data = dt, x = ~x, y = ~y, type = 'scatter', mode = 'lines') %>%
  layout(xaxis = list(tickformat = '%a %e %b \n %Y'))

Created on 2022-03-31 by the reprex package (v2.0.1)
In specting the above object with plotly_json() and search for tickformat reveals that the format has been updated to: %a %e %b <br /> %Y.
This reprex is an example taken from the javascript documentation where the example shows the correct behaviour of only showing the year 2013 once.
Guía de contribución
Primeros pasos
- Lee el issue completo y luego la guía de contribución del proyecto.
- Comenta en el issue que vas a ocuparte — evita que dos personas hagan lo mismo.
- Haz un fork del repositorio y trabaja en una rama.
- Abre un pull request que haga referencia al número del issue.
Línea de trabajo
Comience con el ejemplo mínimo de R en issue #2115 e inspeccione su salida con plotly_json(), centrándose en cómo el tickformat del eje x convierte \n. Compare el resultado con el comportamiento enlazado de JavaScript y Python; se considera terminado cuando R conserva \n, de modo que los valores de fecha repetidos se muestren según el comportamiento documentado.
Escrito por el modelo de indexación a partir del texto del issue.
Evaluación
- Stack tecnológico
- javascript, r
- Área
- data-visualization
- Tipo de issue
- Error
- Dificultad
- 3/5
- Tiempo estimado
- 1-2 días
- Estado de actividad
- Estancado
- Claridad
- Bastante claro
- Aptitud para principiantes
- 45/100